

Download PDF
Abstract
Physiological host factors, such as the gut microbiome and obesity, independently influence anti-tumour immunity and responses to immune checkpoint inhibitors (ICIs)1, with high body mass index (BMI) having an unexpected link with greater ICI efficacy2,3,4,5,6. However, how these factors interact across diverse dietary contexts remains unclear. Here, using 12 mouse diet models that reflect a spectrum of obesity biology, we characterize diet-driven metabolic, immune and gut microbiota features associated with ICI sensitivity. We find that obesity-associated ICI responses are poorly correlated with metabolic dysfunction and are instead dependent on the diet–gut axis. Obesogenic diets promote a robust and persistent gut microbial ecosystem that is capable of restoring ICI sensitivity following a short-term diet switch or fecal microbiota transplants (FMTs) from non-responder models. Monocolonization of germ-free mice with favourable bacteria such as Lactobacillus johnsonii, together with an obesogenic diet, synergistically promotes tumour regression through an enrichment of microbiota-derived aromatic amino acid metabolites. Moreover, human-to-mouse FMT from donors with a high BMI enhanced ICI efficacy compared with donors with a normal BMI, and an obesogenic diet restored sensitivity following FMT from a non-responder patient. Our study provides insight on epidemiological associations between BMI and ICI efficacy, and suggests that immunomodulatory synergy between diet and the gut microbiota could be leveraged to improve ICI outcomes and FMT interventions.
It has been long appreciated that nutrition regulates anti-tumour immunity, predating the recognition of inflammation as a hallmark of cancer7. As the understanding of anti-tumour immunity has evolved, there is renewed interest in tailoring diet to reduce cancer risk and improve treatment outcomes as part of personalized medicine. ICIs have revolutionized the treatment of many cancers, but durable responses are achieved in only a minority of patients, emphasizing the need to identify host determinants of efficacy. Research over the past decade has established the gut microbiota as a targetable regulator of ICI responses, with diet shaping microbial and metabolic states that influence immune function8,9,10,11. Gut dysbiosis is a hallmark feature of obesity that links diet, the microbiome and health risk factors12; yet paradoxically, epidemiological studies have shown that high BMI is associated with improved ICI responses in several cancer types, including lung cancer and melanoma2,3,4,5,6. Given the multifaceted nature of obesity pathophysiology, it has been challenging to disentangle how it contributes to ICI efficacy using current experimental models.
A key limitation of common preclinical obesity models is their reductionist nature, which does not capture the complexity of this condition in humans. For most of human history, dietary intake was limited by nutrient availability, but industrialization has enabled ad libitum food access in many populations13, although dietary composition varies greatly. By contrast, behavioural and immunological studies that have moved beyond reductionist approaches at the discovery stage of research have yielded unprecedented insights into organismal physiology14. Leveraging this approach to clarify the relationship between obesity and ICI efficacy, we modelled nutritional intake with greater precision than is conventional by using more realistic and diverse in vivo dietary models to dissect the multifaceted effects of obesity on ICI response, focusing primarily on lung cancer as a central model.
Diet shapes metabolic and immune states
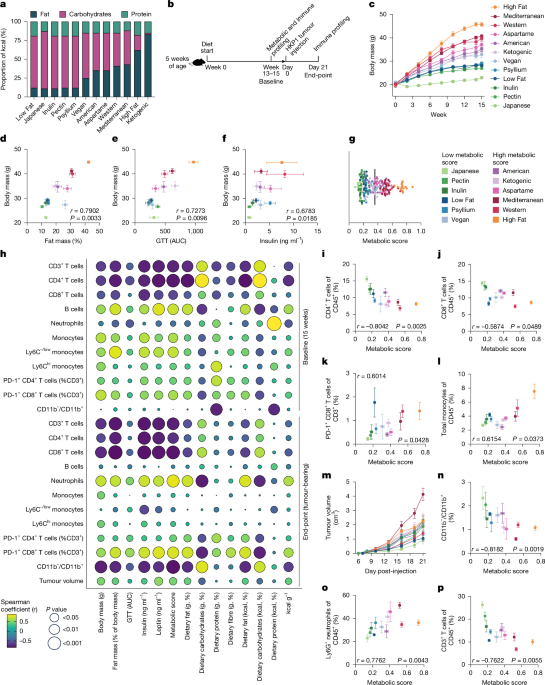
Conventional mouse models of diet-induced obesity often do not represent the complexity of food consumption and its relationship to body weight across human populations, most commonly relying on a diet of 45–60% kcal of fat from lard15. To overcome this, we designed a series of 12 mouse diets to better reflect variation in human dietary patterns16. In addition to traditional Low Fat, High Fat and Western diets, we used diverse ingredients as sources of protein (casein, soy, fish, egg white, beef and pea protein), carbohydrates (corn starch, maltodextrin, wheat, rice, potato, sucrose, fructose, and fruit and vegetable powders), fat (soybean oil, corn oil, menhaden oil, palm kernel oil, butter, lard, flaxseed oil and olive oil) and fibre (cellulose, inulin, pectin and psyllium) to mimic Mediterranean, Japanese, Vegan, American (with and without Aspartame) and Ketogenic diets (Fig. 1a, Extended Data Fig. 1a and Supplementary Tables 1 and 2). Given the well-established prebiotic activity of fibre, we also designed three diets in which cellulose was replaced in the classic Low Fat diet with Psyllium, Inulin or Pectin (Fig. 1a, Extended Data Fig. 1a and Supplementary Tables 1 and 2). After 15 weeks, we observed a range of body weights across diet models, and a diverse distribution of body composition, glucose tolerance, serum insulin and serum leptin levels (Fig. 1b–f and Extended Data Fig. 1b–j). A composite metabolic score was generated from these parameters, with a higher score corresponding to more severe metabolic dysfunction (Fig. 1g and Extended Data Fig. 1k).
a, Proportion of kilocalories from dietary fat, carbohydrates and protein for the experimental diets. b, Schematic of the 15-week diet model corresponding to c–p. c, Body weight over 15 weeks. Japanese: n = 14 mice; all other diets: n = 15 mice; 2 independent cohorts; mean ± s.e.m. d–f, Correlations between average body weight (n = 5 mice per diet) and metabolic assays at baseline, including percentage of fat mass (d; Japanese: n = 9 mice; all other diets: n = 10 mice), glucose tolerance test (GTT) (e; Low Fat, High Fat and Western: n = 10 mice; all other diets: n = 5 mice) and serum insulin (f; Inulin: n = 6 mice; all other diets: n = 5 mice). AUC, area under the curve. g, Diet metabolic score (mean = 0.36 is indicated). Each data point represents one mouse. h, Correlation matrix of blood immune cells, metabolic parameters and nutritional content at baseline (non-tumour-bearing) and end-point (tumour-bearing). Bubble colour represents Spearman correlation coefficient; bubble size indicates the P value. i–l, Correlation between average metabolic score (n = 5 mice per diet) and baseline blood flow cytometry (n = 5 mice per diet) for CD4+ T cells (i), CD8+ T cells (j), PD-1+ CD8+ T cells (k) and monocytes (l). m, HKP1 tumour kinetics by calliper in the 15-week diet model. Pectin, Inulin, American and Vegan: n = 4 mice; all other diets: n = 5 mice; mean ± s.e.m. n–p, Correlation between average metabolic score (n = 5 mice per diet) and end-point blood flow cytometry (Pectin, American and Vegan: n = 4 mice, all other diets: n = 5 mice) for lymphoid:myeloid ratio (n), neutrophils (o) or CD3+ T cells (p). Correlations were calculated using two-tailed Spearman correlation and are presented as mean ± s.e.m. All immune cells are calculated as percentage of CD45+ cells unless otherwise indicated.
Source data
There is a well-established link between obesity, nutrition and immune alterations11,17,18,19. We therefore investigated differences in circulating immune populations at steady state in response to each diet (Fig. 1h and Supplementary Data Fig. 1). Consistent with previous work20, we observed a significant inverse correlation between metabolic score and both CD4+ (r = −0.8042, P = 0.0025) and CD8+ (r = −0.5874, P = 0.0489) T cell abundance in the peripheral blood across diet models (Fig. 1i,j). Moreover, we found a significant positive association between metabolic score and the frequency of PD-1+ CD8+ T cells among total CD3+ T cells (r = 0.6014, P = 0.0428) (Fig. 1k). Within the myeloid compartment, monocytes were significantly correlated with increasing metabolic score (r = 0.6154, P = 0.0373) (Fig. 1l), a relationship that was more evident in patrolling subsets (Ly6C−/low; r = 0.6783, P = 0.0185) than in inflammatory subsets (Ly6Chi; r = 0.4056, P = 0.1928) (Supplementary Data Fig. 1). These changes were of particular interest given the link between these immune populations and ICI efficacy in lung cancer21, and the paradoxical role for obesity in ICI treatment response2,3,4,5,6.
Accordingly, we next examined how these systemic immune changes were maintained in the context of cancer. We focused on a KrasG12DTrp53−/− HKP1 model, given the clinical relevance of lung cancer to understanding mechanisms of ICI response, including in the obesity setting4. As expected, we did not find a correlation between tumour volume and body weight, glucose intolerance, serum insulin and leptin levels, or metabolic score (Fig. 1m and Supplementary Data Fig. 2). This confirmed that our model recapitulates clinical observations that obesity does not promote lung cancer progression, unlike many other cancer types22,23,24,25,26. Nevertheless, we observed substantial variation in immune composition across models in peripheral blood and end-point tumours (Fig. 1h, Extended Data Fig. 2a,b and Supplementary Data Fig. 2). Specifically, there was a significant inverse correlation between metabolic score and the ratio of lymphoid-to-myeloid cells in peripheral blood, whereby diets that induced obesity had a reduced CD11b−/CD11b+ cell ratio (r = −0.8182, P = 0.0019) compared with diets that did not induce obesity (Fig. 1n). This ratio was largely driven by an enrichment in neutrophils (r = 0.7762, P = 0.0043) and a reduction of T cells (r = −0.7622, P = 0.0055) in tumour-bearing mice (Fig. 1o,p), consistent with previous findings27,28,29. These observations suggest that although lung tumour growth is not accelerated by obesity, these tumours may be differentially primed for immune-targeted therapies.
The diet–gut axis and ICI efficacy
Dietary nutrients shape the gut microbiome, which is known to have immunomodulatory effects8,30,31. Therefore, we next explored differences in gut microbiota composition across our diet models using bacterial 16S ribosomal RNA (rRNA) gene sequencing. There was a high degree of variation in the predominating phylum (Fig. 2a) and family (Fig. 2b and Extended Data Fig. 3a) for each individual diet, highlighting the diverse biology established in our models. Although it has been reported that obesity is associated with a reduction in bacterial diversity12,32, we observed comparable alpha diversity across diets, with the exception of the nutritionally complex Vegan diet, which exhibited increased diversity (Extended Data Figs. 1a and 3b–e). At the level of individual amplicon sequence variants (ASVs), we found that mice consuming diets with high fat content (diets designated: Ketogenic, American, Aspartame, Western and High Fat) exhibited similarities to each other, with the exception of the Mediterranean diet, which was more similar to the lean diets (Japanese, Pectin, Inulin, Low Fat and Psyllium diets) (Figs. 1a and 2c). To identify bacteria associated with obesity, we divided diets on the basis of their metabolic score, resulting in 6 diets above the mean (0.36) and 6 below the mean (Fig. 1g). At the phylum level, there was a general enrichment in Bacillota (formerly Firmicutes) in mice with a high metabolic score compared with those with a low metabolic score (Fig. 2d and Extended Data Fig. 3f). This was driven by an increase in the presence of Lactobacillaceae (largely comprised of the genus Lactobacillus), Peptostreptococcaceae and Streptococcaceae (Fig. 2d), which have previously been linked to obesity and consumption of a high fat diet33,34. Of particular interest, enriched bacteria within each metabolic score category were diverse, emphasizing the importance of the diet–gut axis even in mice of similar body weight (Fig. 2c,d).
a,b, 16S rRNA gene sequencing showing taxonomic composition of fecal bacteria at phylum (a) and family (b) levels at baseline. Diets are ordered by decreasing metabolic score, from left to right. Bars represent individual mice. c, PCoA (16S rRNA gene sequencing) using Bray–Curtis distance matrix at the ASV level for fecal bacterial DNA at baseline. d, Linear discriminant analysis effect size (LEfSe) analysis for fecal bacteria associated with high or low metabolic score diets (asterisks indicate P < 0.05, false discovery rate (FDR) < 0.1, linear discriminant analysis (LDA) ≥ 2). Bubble size represents normalized relative abundance of a given family (f_) or genus (g_); bubble colour indicates phylum. Diets are ordered by decreasing metabolic score, from left to right. e, ICI trial schematic corresponding to f. f, HKP1 tumour kinetics by calliper in IgG- or anti-PD-1-treated mice. IgG (Psyllium, Ketogenic, Pectin, Low Fat, American and Aspartame) and anti-PD-1 (Mediterranean, Japanese, Western, Inulin, American, Aspartame and High Fat): n = 5 mice; IgG (Mediterranean, Japanese, Vegan, Western, Inulin and High Fat) and anti-PD-1 (Ketogenic, Vegan, Pectin and Low Fat): n = 4 mice; anti-PD-1 (Psyllium): n = 3 mice. Multiple two-tailed Mann–Whitney tests; mean ± s.e.m. g, Anti-PD-1 sensitivity index calculated from end-point tumour volumes of IgG and anti-PD-1-treated groups as shown in f. Data are mean ± s.e.m.
Source data
In patients with cancer and in preclinical cancer models, Lactobacillus spp. is associated with favourable response to ICI35,36,37,38,39,40. Given the association between high metabolic score and Lactobacillaceae, we next compared ICI efficacy across diet models (Fig. 2e). Anti-PD-1 sensitivity was strongly influenced by diet, with some diets eliciting significant responses and others not (Fig. 2f and Extended Data Fig. 4a). We calculated a score for each diet based on the degree of sensitivity at the end-point (Fig. 2g). Across all 12 diets, we did not observe significant associations between ICI score and body weight, fat mass, glucose intolerance, serum insulin and leptin levels, or metabolic score (Extended Data Fig. 4b–g). However, of the diets most sensitive to anti-PD-1, three out of four were associated with obesity (American, Aspartame, High Fat) (Fig. 2g). More broadly, we found that among all obesogenic diets, 4 out of 6 (66.7%) were associated with ICI response, compared with only 2 out of 6 (33.3%) of the non-obesogenic diets (Extended Data Fig. 4h). These findings are consistent with epidemiological studies linking high BMI with ICI efficacy2,3,4,5,6, but suggest this association may reflect diet-dependent biological features that may not be fully captured by BMI alone. Instead, our model captures a spectrum of obesity phenotypes, whereby distinct obesogenic diets can produce similar weight gain while exerting differential effects on cancer growth and immunotherapy response.
Early microbial correlates of ICI response
To further explore the mechanisms of anti-PD-1 efficacy in our model, we compared microbial composition between the top four ICI-responder diets (High Fat, Aspartame, American and Inulin), and four non-responder diets (Ketogenic, Japanese, Mediterranean and Psyllium). Responders exhibited higher richness (Chao1 index) with lower Shannon diversity compared with non-responders (Extended Data Fig. 5a), suggesting a greater number of bacterial taxa overall, potentially with less evenly distributed community structure (whereas non-responders exhibited the opposite pattern). Of note, microbiome diversity indices were similar between IgG and anti-PD-1 groups within the same diet model, indicating that microbiome features were primarily driven by diet rather than treatment (Extended Data Fig. 5b). Diets associated with non-responsiveness to anti-PD-1 were associated with an enrichment in Bacteroidaceae and Sutterellaceae, whereas Lactobacillaceae were enriched in responders (Fig. 3a and Extended Data Fig. 5c). At the genus level, Lactobacillus in particular was enriched in responders, whereas non-responders had lower levels of Lactobacillus and instead displayed an enrichment in Bacteroides; this pattern was observed both before tumour injection and at the trial end-point (Fig. 3b,c). Notably, Lactobacillus was increased in all three obesity-inducing diets that were sensitive to ICI; by contrast, the presence of Lactobacillus was reduced in response to the Inulin diet (which was ICI-sensitive, but lean) and in response to the Mediterranean diet (which caused weight gain, but remained ICI-insensitive in our model) (Fig. 3a and Extended Data Fig. 5d–f). Together, these data suggest that enrichment of Lactobacillaceae (particularly Lactobacillus) may contribute to obesity-associated ICI efficacy.
a, LEfSe analysis for fecal bacteria associated with the top 4 responsive and non-responsive diets (asterisks indicate P < 0.05, FDR < 0.1, LDA ≥ 2). Bubble size indicates normalized relative abundance of a given family (f_) or genus (g_); bubble colour represents phylum. b,c,Bacteroides and Lactobacillus from 16S rRNA gene sequencing on fecal samples before tumour injection (b) and at the end-point (anti-PD-1-treated mice only) (c). Non-responder (NR): n = 27 pre-tumour mice, n = 15 end-point mice; responder (R): n = 29 pre-tumour mice, n = 16 end-point mice. d–h, Flow cytometry analysis of anti-PD-1-treated mice, quantifying intratumoural T cells (d), neutrophils (e), neutrophil:T cell ratio (f) and PD-1+Ki-67− T cells (g), and blood PD-1+Ki-67− T cells (h). Non-responder tumour: n = 15 mice; responder tumour: n = 19 mice; non-responder blood: n = 18 mice; responder blood: n = 20 mice. i, PCoA (16S rRNA gene sequencing) using Bray–Curtis distance matrix at the ASV level for fecal bacterial DNA after 3 and 15 weeks on diet. Homogeneity of group dispersions (PERMDISP) test. j, Body weight increase between 3 and 15 weeks of diet; n = 15 mice per group, 2 independent cohorts. k, Schematic of the 3-week diet model corresponding to l,n,o. l, HKP1 tumour kinetics by calliper comparing 3-week and 15-week models. 3-week, High Fat: n = 4 mice; 3-week, all other groups:, n = 5 mice; 15-week data are from Fig. 1m. m, HKP1 tumour kinetics by calliper in IgG- or anti-PD-1-treated mice in the 3-week diet model. Left, Psyllium diet; right, High Fat diet. n = 5 mice per group. n,o, Intratumoural CD3+ T cells (n) and PD-1+Ki-67−CD8+ T cells (o) in the 3-week model. Non-responders: n = 10 mice; responders: n = 18 mice. Data are mean ± s.e.m. Two-tailed Mann–Whitney test (b,c,e–h,l–n); two-tailed unpaired t-test (d,o).
Source data
We next explored intratumoural immune changes associated with anti-PD-1 efficacy. Responders had higher CD3+ T cell frequencies within the total leukocyte compartment of the tumour compared with non-responders (Fig. 3d); however, non-responders exhibited higher Ly6G+ neutrophils (Fig. 3e) and neutrophil-to-T cell ratios (Fig. 3f), which are features linked to ICI resistance41,42. Among tumour-infiltrating T cells, a greater proportion of PD-1+Ki-67− T cells within both CD4+ and CD8+ compartments were found in tumours that were non-responsive to anti-PD-1 (Fig. 3g)—a pattern that was also observed in the peripheral blood at the end-point (Fig. 3h). These data are suggestive of a resting or non-proliferative phenotype that is typically associated with shorter progression-free and overall survival in patients with non-small cell lung cancer (NSCLC) receiving anti-PD-1 (ref. 43), and reinforce the notion that T cell presence alone does not necessarily reflect productive activation during anti-PD-1 therapy44.
Finally, given our hypothesis that diet influences obesity-associated ICI sensitivity via the gut microbiome, we uncoupled microbial effects from body weight in models with a high metabolic score. Longitudinal bacterial 16S rRNA gene sequencing of fecal samples revealed that microbiome composition was largely stabilized after short-term diet exposure (by 3 weeks), prior to subsequent weight gain from longer-term exposure (up to 15 weeks) (Fig. 3i,j and Extended Data Fig. 6a). Reflecting microbiome similarity between these time points, tumour growth after 3 weeks of diet was comparable to 15 weeks (Fig. 3k,l and Extended Data Fig. 6b–d), despite marked differences in body weight. Consistently, broad-spectrum antibiotics altered tumour growth kinetics in most obesogenic models (Extended Data Fig. 6e,f), further supporting a microbiome effect. Importantly, when focusing on the top (High Fat) and bottom (Psyllium) anti-PD-1 responders from 15-week trials (Fig. 2g), their response status was recapitulated after 3 weeks of diet exposure across tumour models, including HKP1 lung cancer (Fig. 3m) and YUMM1.7 and YUMMER1.7 melanoma (Extended Data Fig. 6g,h). Moreover, diets associated with response exhibited increased T cell infiltration in the tumour, with a significant reduction in the proportion of PD-1+Ki-67−CD8+ T cells (Fig. 3n,o), suggesting that these tumours exhibit immune features of ICI response even in this short-term diet model prior to the onset of obesity. Together, these results indicate that although the extent of microbiome involvement in tumour modulation may differ between dietary models, it is relevant to most obesogenic contexts.
Diet remodels the microbiome to shape ICI response
We next explored the possibility that diet regulation of ICI efficacy was driven by the microbiome using two orthogonal approaches. Given the association between Lactobacillus and obesity-associated anti-PD-1 response, we first hypothesized that switching ICI-non-responder mice from a diet associated with low Lactobacillus to one associated with high Lactobacillus would be sufficient to sensitize mice to therapy. We focused on the 3-week model of diet exposure (rather than the 15-week model) as an early diet-conditioning window to test whether microbial remodelling could influence anti-PD-1 efficacy before the emergence of broader obesity-associated metabolic changes. Mice were fed the Psyllium diet (top ICI-non-responder diet) and then switched to High Fat diet (top ICI-responder diet) 48 h prior to anti-PD-1 treatment (Fig. 4a and Extended Data Fig. 7a). Remarkably, switching diet from Psyllium to High Fat was sufficient to sensitize HKP1 tumours to anti-PD-1 in the absence of any other pharmacological interventions (Fig. 4b,c). Conversely, switching mice from the High Fat diet to the Psyllium diet desensitized tumours to anti-PD-1 (Fig. 4d–f). Although T cell infiltration within tumours did not differ between diet switch conditions (Extended Data Fig. 7b,c), switching from Psyllium to High Fat was associated with improved functional status of intratumoural CD4+ and CD8+ T cells, including increased IFNγ and TNF production (Fig. 4g–i and Extended Data Fig. 7d,e). This was accompanied by a rapid enrichment of Lactobacillus and reduction of Bacteroides in the fecal microbiota, detectable as early as 48 h after the diet switch (Fig. 4j), with the opposite effect observed for the High Fat to Psyllium diet switch (Fig. 4k).
a, Psyllium to High Fat (Psy to HF) diet switch trial schematic corresponding to b,c,g–j. b,c, HKP1 tumour kinetics by calliper (b) and end-point tumour volume (c) following a switch from the Psy to HF diet. n = 10 mice per group, 2 independent cohorts. d, High Fat to Psyllium (HF to Psy) diet switch trial schematic corresponding to e–i,k. e,f, HKP1 tumour kinetics by calliper (e) and end-point tumour volume (f) following a switch from HF to Psy diet. IgG: n = 8 mice; anti-PD-1: n = 10 mice; 2 independent cohorts. g–i, Flow cytometry analysis of intratumoural CD8+ T cells from anti-PD-1-treated mice, quantifying production of IFNγ (g) and TNF (h), and expression of CD44, CD11a, GZMB and PD-1 (i). Psy to HF: n = 4 mice; HF to Psy: n = 5 mice. j,k, Quantitative PCR (qPCR) to detect Lactobacillus spp. and Bacteroides spp. in fecal samples from anti-PD-1-treated mice in the Psy to HF diet switch model (j) or the HF to Psy diet switch model (k). n = 6 mice, each with paired stool samples that include one before and one 48 h after the diet switch. l, Psy donor to HF recipient FMT model schematic corresponding to m–o. Abx, antibiotic treatment. m,n, HKP1 tumour kinetics by calliper (m) and end-point tumour volume (n) in the Psy donor to HF recipient FMT model. IgG: n = 10 mice; anti-PD-1: n = 13 mice; 2 independent cohorts. o, PCoA (16S rRNA gene sequencing) using Bray–Curtis distance matrix at the ASV level for fecal bacterial DNA from the FMT trial. permutational multivariate ANOVA (PERMANOVA) test, n = 5 mice per group. Tx, treatment. Data are mean ± s.e.m. Two-tailed Mann–Whitney test (b,c,e–i,m,n), two-tailed Wilcoxon test (j,k).
Source data
Given these results and ongoing clinical trials using FMT to overcome ICI resistance40,45,46,47, we investigated dietary-tailored FMT as a complementary approach to our diet switch model. First, treatment of mice on the High Fat diet with continuous broad-spectrum antibiotics was sufficient to desensitize tumours to anti-PD-1 treatment (Extended Data Fig. 8a,b), reinforcing a role for the microbiota. Moreover, ex vivo stimulation of CD8+ T cells with phorbol 12-myristate 13-acetate (PMA) and ionomycin in the presence of fecal homogenate from High Fat diet mice enhanced effector molecule production compared with PBS or antibiotic controls (Extended Data Fig. 8c). As a complementary approach, High Fat diet-fed mice were pretreated with antibiotics and then received weekly FMTs from Psyllium diet donors, while continuing the High Fat diet for the trial duration. Despite receiving FMT from non-responder donors, mice consuming the High Fat diet were sensitive to anti-PD-1 (Fig. 4l–n). By contrast, anti-PD-1 was ineffective in mice consuming the Psyllium diet throughout the trial, and in control High Fat diet-fed mice gavaged with PBS instead of FMT (Extended Data Fig. 8d–j). We hypothesized that the continued High Fat diet fostered a favourable microbiome consortium, despite the use of fecal material from non-responder donors. Supporting this, bacterial 16S rRNA gene sequencing and principal coordinate analysis (PCoA) showed that recipients of Psyllium diet donor FMT progressively diverged from their donors and, by end-point, clustered with the High Fat diet-fed mice (Fig. 4o), marked in part by a significant reduction in Muribaculaceae (Extended Data Fig. 8k–m) (associated with anti-PD-1 resistance; Fig. 3a). Overall, these findings provide proof of principle that diet can shape microbiome reconstitution after FMT and, in some contexts, override the effects of donor material.
Microbial metabolites link diet to ICI
Having identified the gut microbiome as a mediator of diet-associated ICI sensitivity, we next sought to identify the bacterial species and functional pathways involved. Metagenomic sequencing of fecal samples collected after 3 weeks from mice consuming obesogenic ICI-responder diets (High Fat, American) or non-responder diets (Ketogenic, Mediterranean) identified L. johnsonii as the top enriched bacterial species associated with response (Fig. 5a–c), consistent with 16S rRNA gene sequencing results (Fig. 3a). To investigate the functional role of L. johnsonii in regulating ICI sensitivity, we performed monocolonization experiments in germ-free mice exposed continuously to the High Fat diet. Remarkably, combining the High Fat diet with L. johnsonii resulted in a striking anti-tumour effect following anti-PD-1 treatment (Fig. 5d–f and Extended Data Fig. 9a–c). Similar results were observed in antibiotic-treated specific pathogen-free mice fed a High Fat diet, in which L. johnsonii supplementation led to complete responses in all mice treated with anti-PD-1 (Fig. 5g,h). Notably, the robust effect of the High Fat diet was mediated by the presence of L. johnsonii, as oral gavage with PBS yielded no effect on anti-PD-1 sensitivity (Fig. 5e–h).
a, PCoA (shotgun metagenomics) of Bray–Curtis dissimilarities in fecal microbiome after 3 weeks of obesogenic responder or non-responder diets. Shading shows 95% confidence intervals; vectors represent top 15 species by SIMPER; arrow length indicates magnitude of contribution and direction represents correlation with ordination axes. PERMANOVA test, n = 3 mice per group. b, LEfSe analysis for fecal bacteria species associated with obesogenic responder and non-responder diets (n = 3 mice per diet; top 15 taxa with P < 0.05, FDR < 0.1, LDA ≥ 2). Bubble size represents normalized relative abundance and bubble colour indicates family. Amer, American; Keto, Ketogenic; Med, Mediterranean. c, L. johnsonii abundance from metagenomic data in a,b. Ob_NR, obesogenic non-responder diet; Ob_R, obesogenic responder diet. d, Schematic for monocolonization (germ-free (GF)) and single-strain supplementation (specific pathogen-free (SPF)) models corresponding to e–h. e,f, HKP1 tumour kinetics by calliper (e) and end-point tumour volume (f) in the monocolonization model. L. johnsonii (Lj): n = 10 mice per group; PBS: n = 9 mice per group; 2 independent cohorts. g,h, HKP1 tumour kinetics by calliper (g) and end-point tumour volume (h) in the single-strain supplementation model. n = 5 mice per group. i, Schematic for human-to-mouse FMT from an ICI-refractory donor, corresponding to j–l. j,k, HKP1 tumour kinetics by calliper (j) and end-point tumour volume (k) in FMT recipient mice. High Fat diet plus IgG: n = 4 mice; all other groups: n = 5 mice. l, qPCR for L. johnsonii in faeces from FMT recipients after anti-PD-1 treatment. Psyllium: n = 5 mice; High Fat: n = 4 mice; one stool per mouse. m, Pathway enrichment (serum metabolomics) from obesogenic responder versus non-responder models. Bubble size represents pathway effect; bubble colour indicates significance. n, Normalized concentration (log2(ratio)) of tryptophan-derived (top) and tyrosine-derived (bottom) metabolites in obesogenic responders versus non-responders. HP, hydroxyphenyl. o–q, Normalized concentration (log2(ratio)) of serum DAT in anti-PD-1-treated mice from the monocolonization model (o; n = 5 mice per group), serum DAT in mice on obesogenic responder versus non-responder diets (p; n = 10 mice per group, including 5 mice per diet) and DAT in bacterial supernatants (q; n = 3 independent cultures). r, Schematic for generating diet-conditioned intratumoural T cells, corresponding to s. s, Flow cytometry for IFNγ and TNF from intratumoural CD8+ T cells after DAT stimulation, normalized to vehicle. n = 4 wells per group, with T cells from 5 mice per group. t, DAT supplementation trial schematic, corresponding to u,v. u,v, HKP1 tumour kinetics by calliper (u) and end-point tumour volume (v) in the DAT supplementation trial. n = 5 mice per group. w, Differentially abundant plasma metabolites from ICI responder versus non-responder patients with NSCLC. Fold change threshold = 1.2; P value threshold < 0.05. DHICA, 5,6-dihydroxyindole-2-carboxylic acid. x,y, Normalized concentration (log2(ratio)) of indolelactic acid (x) and 3-hydroxy-3-(3-hydroxyphenyl) propionic acid-O-sulfate (3-HPP sulfate) (y) in plasma of ICI responders (n = 32 patients) and non-responders (n = 21 patients). Data are mean ± s.e.m.; two-tailed unpaired t-test (c,l,s,x), two-tailed Mann–Whitney test (e,g,j,n,p,u,y), one-way ANOVA Kruskal–Wallis test (f,h), one-way ANOVA with Tukey’s multiple comparisons test (k,o,v) and one-way ANOVA with Dunnett’s multiple comparisons test (q). NS, not significant.
Source data
To uncouple the relative contributions of diet and the microbiota in these experiments, we performed two complementary controls: colonization with the top non-responder species (M. gordoncarteri; Fig. 5a,b) in mice maintained on the High Fat diet (Extended Data Fig. 9d–h); or colonization with L. johnsonii in mice fed the non-responder Psyllium diet (Extended Data Fig. 9i–k). Although both conditions conferred partial sensitivity to anti-PD-1, only the combination of High Fat with L. johnsonii induced tumour clearance (Fig. 5f,h), indicating a synergistic interaction between diet and microbiota. Reflecting this, among mice monocolonized with L. johnsonii, the High Fat diet supported a higher fecal abundance at the end-point than the Psyllium diet (Extended Data Fig. 9l). These findings indicate that diet and the microbiome can each influence ICI efficacy, as expected; however, their optimal combination maximizes therapeutic benefit.
To test whether diet can modulate the functional output of a human-derived microbiota, we performed FMT using donor stool from an ICI-non-responder patient with lung cancer, into recipient mice on the Psyllium or High Fat diet (Fig. 5i and Supplementary Table 3). Remarkably, mice exposed to the Psyllium diet remained insensitive to anti-PD-1, consistent with the non-responder status of the donor; however, mice exposed to the High Fat diet were sensitized to anti-PD-1, despite receiving the same donor microbiota (Fig. 5j,k). This diet-driven rescue of ICI response was associated with increased L. johnsonii in the stool of High Fat-fed mice compared with Psyllium-fed mice at the end-point (Fig. 5l). These findings reinforce the notion that dietary context can override donor responder status by reshaping transplanted microbiota, further supporting a model in which diet and microbiota interactions cooperatively influence immunotherapy efficacy.
To further explore functional synergies between obesogenic diets and the gut microbiome, we performed untargeted metabolomics on serum collected after 13 weeks of diet consumption. Pathway analysis revealed aromatic amino acid metabolism, particularly tryptophan and tyrosine pathways, among the top enriched metabolic signatures in obesogenic responders versus non-responders, including increased levels of several indole- and phenolic-derived metabolites (Fig. 5m,n, Extended Data Fig. 10a,b and Supplementary Table 4). Among these, we were initially drawn to the tryptophan metabolite indole-3-lactic acid (ILA) owing to its relationship to the Lactobacillus genus in the context of anti-tumour immunity; for example, in colorectal cancer, ILA from Lactobacillus plantarum has been shown to promote priming of CD8+ T cells against tumour growth48, and in melanoma, another related indole-derived tryptophan metabolite (indole-3-aldehyde) from Lactobacillus reuteri has been linked with immunotherapy response39. Building on this, we tested the functional effect of several tryptophan metabolites on T cells during ex vivo stimulation with anti-CD3/CD28, and found that ILA had the most pronounced effect on PD-1, Ki-67, IFNγ and GZMB levels (Extended Data Fig. 10c), consistent with its enrichment in serum from obesogenic responder versus non-responder diet models (Extended Data Fig. 10d). However, in germ-free mice monocolonized with L. johnsonii, in which a significant anti-tumour effect of High Fat diet was observed (Fig. 5e,f), ILA levels were undetectable in the serum (Supplementary Table 5). These data suggest that although ILA levels are increased in the context of obesogenic diets and ICI efficacy, and may functionally influence T cell activity (as has been shown by others48), it is unlikely that ILA is a direct product of L. johnsonii in our model and therefore it cannot fully explain our observations related to diet–microbiome synergy.
As an alternative hypothesis, we investigated amino acid metabolism more broadly in our monocolonization model (Fig. 5e,f), which could be attributed to L. johnsonii by-products. We found that serum levels of desaminotyrosine (3-(4-hydroxyphenyl)propionic acid; DAT) were significantly higher in L. johnsonii-monocolonized mice consuming High Fat diet compared with those consuming the Psyllium diet (Fig. 5o and Supplementary Table 5), suggesting that this metabolite is diet-tunable. Consistently, we found a significant enrichment in DAT in serum from obesogenic responder versus non-responder diet models (Fig. 5p and Supplementary Table 4). DAT is a microbiota-derived phenylpropionate produced during tyrosine metabolism, previously described to have immunomodulatory properties, including the ability to influence host antiviral and anti-tumour immunity49,50,51. To verify a direct microbial contribution in our model, we confirmed DAT levels remained low when a High Fat diet was administered to germ-free mice in the absence of L. johnsonii (Fig. 5o and Supplementary Table 5). Moreover, DAT concentrations were slightly elevated in supernatants from purified live L. johnsonii cultures compared with control media, whereas this was not the case for purified Lactobacillus gasseri or heat-killed L. johnsonii (Fig. 5q and Supplementary Table 6). Therefore, we shifted our focus to DAT as a potential candidate that mediates diet–microbiome synergy, and proceeded to evaluate its effects in both ex vivo models and in vivo models.
First, we tested the effects of DAT on T cell function ex vivo. Using the YUMM1.7 melanoma model, we isolated tumour-infiltrating T cells from High-Fat-fed mice and Psyllium-fed mice and treated them with DAT ex vivo. We found elevated production of the effector cytokines IFNɣ and TNF in the context of a High Fat diet (Fig. 5r,s), suggesting that DAT acts within a diet-conditioned environment to enhance effector function. To further investigate direct interactions between the microbiome and T cell activation in the context of DAT supplementation, we exposed activated CD8+ T cells to fecal homogenate from Psyllium-fed mice in the presence of exogenous DAT treatment. Following stimulation with PMA and ionomycin, fecal homogenates from Psyllium-fed mice did not increase effector molecule production (GZMB, IFNγ and TNF). By contrast, DAT supplementation enhanced CD8+ T cell effector responses, with the strongest effect observed when T cells were primed with both fecal homogenate and DAT together (Extended Data Fig. 10e). Collectively, these findings support a role for DAT in potentiating microbiota-conditioned CD8+ T cell function.
To complement those ex vivo studies, we tested whether DAT supplementation was sufficient to sensitize a non-responsive diet model to ICI in vivo. Mice were fed a Psyllium diet and maintained on DAT-supplemented drinking water (or vehicle control), followed by injection with HKP1 tumour cells. Recapitulating our previous findings with the Psyllium diet (Fig. 3m), anti-PD-1 remained ineffective in vehicle-treated mice; however, DAT supplementation was sufficient to reverse this effect and sensitize mice to therapy (Fig. 5t–v). This confirmed a role for the microbial phenylpropionate DAT on T cell functional status and re-sensitization of diet-mediated anti-PD-1 inefficacy.
We therefore next examined how our findings in mice translated to humans. Metabolomic analysis of plasma samples from a cohort of 53 patients with NSCLC treated with ICI revealed elevated amino acid-derived metabolites in responders compared with non-responders (Fig. 5w and Supplementary Tables 7 and 8), mirroring the enrichment observed in mice exposed to obesogenic diets (Fig. 5p and Extended Data Fig. 10f). Among these, responders exhibited increased levels of ILA (Fig. 5x and Supplementary Table 7) and 3-hydroxy-3-(3-hydroxyphenyl) propionic acid-O-sulfate (Fig. 5y and Supplementary Table 7), a host-conjugated downstream correlate of DAT within the same phenylpropionate metabolic axis. On the basis of these findings, we reasoned that patients with a high BMI would be more likely to confer sensitivity to anti-PD-1 in human-to-mouse FMT experiments. To test this, we transferred fecal material from 3 low-BMI donors (BMI < 25) and 6 high-BMI donors (BMI ≥ 25) into mice treated with antibiotics, followed by tumour implantation and anti-PD-1 treatment. Remarkably, a significant effect of anti-PD-1 was observed in mice receiving FMT from high BMI donors, whereas no effect was observed following FMT from low-BMI donors (Extended Data Fig. 10g–i and Supplementary Table 9). Notably, the few responding mice within the low-BMI group all received FMT from the same individual donor, whose BMI (24.95) was near the threshold for overweight classification (BMI ≥ 25) (Extended Data Fig. 10i). Collectively, these findings reinforce a tyrosine-derived microbial phenylpropionate pathway linking diet to ICI efficacy, while leaving open potential contributions from broader aromatic amino acid metabolism.
Discussion
Here we show that obesogenic diets contribute to the paradoxical link between high BMI and improved ICI efficacy, and can act independently of obesity itself. Across 12 diets spanning a spectrum of obesity phenotypes, ICI efficacy was dependent on the diet–gut axis rather than metabolic dysfunction, creating a favourable host ecosystem for therapy. We identified L. johnsonii as one of several key species associated with anti-PD-1 response, consistent with prior reports linking Lactobacillus with checkpoint blockade efficacy38,52,53. FMT, monocolonization, and diet switch experiments demonstrated that diet was more influential than microbiota composition alone, with maximal benefits observed when favourable bacteria were paired with favourable diets, due to synergistic metabolic remodelling. Mechanistically, we identified aromatic amino acid metabolites as functional mediators of ICI efficacy. In particular, tyrosine-derived phenylpropionate metabolism was a key pathway leading to production of DAT and related metabolites, which enhanced T cell effector function. As DAT is not typically associated with L. johnsonii, we believe that this finding may reflect strain- or disease-specific responses to a diet-conditioned host context. In parallel, we observed a beneficial enrichment of indole-containing tryptophan metabolites, including ILA, although this was not specifically dependent on Lactobacillus in our model, despite compelling evidence in other contexts39,48,53. However, it remains possible that phenylpropionate- and indole-based pathways may act in a complementary or synergistic manner, involving more complex and compensatory microbial ecosystems rather than L. johnsonii alone. Together, our findings show that diet shapes both microbial composition and microbial function to influence therapeutic outcomes.
By moving beyond reductionist models of diet-induced obesity, we captured a spectrum of obesity biology that helped explain its paradoxical link with ICI efficacy. Several findings, however, warrant further study. First, obesogenic diets were not uniformly beneficial. For example, the Mediterranean diet (high in fat from olive oil) retained a microbiota resembling lean, metabolically healthy mice, including low Lactobacillus, and remained ICI-insensitive. Conversely, the Inulin diet was lean and ICI responsive, yet had a distinct microbial composition characterized by low Lactobacillus and high Bifidobacteria35,54. These effects may reflect microbial influences not explored here, such as antigen mimicry and innate immune priming55,56. Diet may also exert microbiome-independent effects on tumour growth that depend on the duration of exposure, as illustrated by the Ketogenic diet, which showed a trend toward greater anti-tumour activity after short-term feeding (3-week model) and was not affected by broad-spectrum antibiotics. Second, our study used transplantable subcutaneous tumour models as proof of concept that diet influences ICI response. However, spontaneous orthotopic models are needed to determine how tissue-specific microenvironments interact with host microbial and metabolic states. Although we observed minimal changes in bacterial composition in the presence versus absence of tumours (Extended Data Fig. 11), these analyses were performed at very early disease stages and do not exclude tumour-driven changes in microbial function. Third, while L. johnsonii was sufficient to support aromatic amino acid metabolism in our models, it is unlikely to be the sole microbial contributor. Other bacterial species or consortia that are more efficient at supporting tyrosine-derived phenylpropionate metabolism may exert similar or better effects on anti-PD-1 responsiveness, whereas counter-regulatory taxa may favour alternative metabolic pathways, such as those associated with M. gordoncarteri. Therefore, specific metabolites, rather than any single bacterial taxon, may represent more conserved and clinically relevant determinants of response, emphasizing the importance of the microbial ecosystem as a whole.
From a translational perspective, despite their ability to enhance ICI efficacy in our models, prolonged obesogenic diets are associated with well-established health risks and are not proposed as long-term interventions for patients with cancer. Rather, our work highlights the therapeutic potential of short-term dietary modulation, and of specific bacteria or microbial-derived metabolites, to create an optimal host ecosystem for immunotherapy responses. Moreover, although FMT holds promise for improving outcomes in ICI-refractory patients10,45,46, our findings indicate that dietary modification could serve as a complementary or alternative strategy to FMT, consistent with findings that diet outperforms FMT in recovering the microbiome in antibiotics-treated mice57. This was evident not only with the High Fat diet but also with the Psyllium diet, which impaired anti-PD-1 responses in otherwise sensitive cancer models. Finally, several studies have reported greater ICI efficacy in male compared with female patients, including those with a high BMI2,58,59. However, our single-strain enrichment experiments with L. johnsonii and High Fat diet were recapitulated in female mice with lower body weight, supporting the generalizability of potential intervention strategies. Together, our findings identify diet–microbiome synergy as a mechanistic basis for the obesity paradox in cancer immunotherapy and a tractable target for improving therapeutic responses across diverse patient populations.
Methods
Cell lines and culture conditions
HKP1 cells were provided by V. Mittal. YUMM1.7 and YUMMER1.7 were provided by I. Watson. HKP1, YUMM1.7 and YUMMER1.7 cells were cultured in Dulbecco’s modified Eagle’s medium (DMEM) supplemented with 10% FBS and 1% penicillin and streptomycin. MCA205 cells were provided by J. Stagg and were cultured in RPMI-1640 medium containing 10% FBS, 2 mM l-glutamine and 100 UI ml−1 penicillin and streptomycin. Cells were cultured at 37 °C in the presence of 5% CO2. Cell lines were not authenticated and were routinely tested for mycoplasma contamination.
Animal ethics statement
All animal experiments and data collection were conducted either at the Goodman Cancer Institute (GCI) at McGill University, or the Centre de Recherche du Centre Hospitalier de l’Université de Montréal (CRCHUM). Unless indicated otherwise, tumour assays were monitored for 15–24 days, with early humane end-points, including development of tumour ulceration, total volume exceeding 2.5 cm3, or onset of adverse clinical signs. All procedures were approved by respective institutional animal care committees, including the Comparative Medicine and Animal Resources Centre (CMARC, McGill) or the Institutional Animal Care Committee (IACC, CRCHUM), and experiments adhered to approved humane end-points. All experiments complied with the Canadian Council on Animal Care guidelines.
Standard animal housing
Mice were housed in cages with micro-barrier tops (Allentown) on a standard rack system under specific pathogen-free conditions. Each cage contained up to five mice with corn bedding (Envigo), enrichment (Shepherd), irradiated standard chow in the cage-top (Envigo), and autoclaved water. The animal facility maintained a 12 h:12 h light:dark cycle (lights on at 07:00). The following procedures took place in the morning, within a 2 h window across cohorts: (1) non-terminal blood collection for serum and flow cytometry; (2) all dissections; and (3) fasting for GTT. The following procedures took place in the afternoon, within a 3 h window: (1) body weight; (2) stool collections; (3) tumour injections; (4) anti-PD-1 and IgG treatments and tumour measurements; (5) GTT; (6) EchoMRI; and (7) FMT. Note that germ-free experiments were housed under non-standard conditions (see ‘In vivo experimental models’ for additional detail).
Diets
All diets were designed and produced in collaboration with Research Diets. All diets were irradiated by Research Diets and administered ad libitum. The Mediterranean (powdered), Japanese (powdered) and Ketogenic (paste) diets were provided in special feeders. All other diets were in the form of standard pellets delivered in the cage-top and replenished as needed. The Japanese, Mediterranean, Vegan, American, Aspartame and Ketogenic diets were designed to mimic human dietary patterns in terms of ingredient profiles, macronutrient content, fibre sources and fatty acid ratios (Supplementary Tables 1 and 2). Carbohydrate sources include corn starch, maltodextrin, wheat starch, rice starch, potato starch, sucrose and fructose. The Vegan diet contains spinach, broccoli, apple, banana, blueberry, carrot, raspberry and tomato powder (Nubeleaf). Protein sources include beef protein, casein, soy protein, egg white protein and fish protein. Fat sources include soybean oil, corn oil, menhaden oil, palm kernel oil, butter, lard and flaxseed oil. The modified fibre diets were based on the Low Fat diet, with cellulose exchanged for the different fibre source (inulin, pectin and psyllium). The germ-free mice were fed double-irradiated High Fat or Psyllium diets with 1.5× vitamin supplementation. Proportions of ingredients and macronutrient breakdown can be found in Supplementary Tables 1 and 2.
In vivo experimental models
- 1.
15-week diet model. 15-week diet experiments were performed at the GCI with 4-week-old male C57BL/6J mice purchased from Jackson Laboratories. Upon arrival, mice were fed the standard chow for 1 week during the acclimatization period and were then switched to a special diet for 15 weeks (ad libitum). At 20 weeks of age, mice were injected subcutaneously with 500,000 HKP1 tumour cells in a suspension of 1:1 PBS:Matrigel (Corning). For ICI trials, when tumours were palpable, mice were randomized on a per-cage basis to anti-PD-1 (clone J43, Bio X Cell) or IgG (non-reactive polyclonal Armenian hamster, Bio X Cell), administered intraperitoneally every 3 days until the end-point (16–24 days). Weight-adjusted dosing was used to account for differences in body weight and blood volume (10 mg kg−1 per mouse; Supplementary Table 10). Diet was continued for the duration of the experiment and tumours were monitored by manual calliper. ‘Response’ was defined as a statistically significant reduction in tumour volume in anti-PD-1-treated mice compared with IgG controls, whereas ‘resistance’ was defined as a lack of therapeutic benefit (that is, distinct from hyperprogression, which was not observed in our models).
- 2.
3-week diet model: 3-week diet experiments were performed at the GCI with 12- to 15-week-old male C57BL/6J mice purchased from Jackson Laboratories (age-matched to the 15-week diet model). Upon arrival, mice were fed the standard chow for 1 week during the acclimatization period and were then switched to a special diet for 3 weeks (ad libitum). Mice were then injected subcutaneously with 500,000 HKP1, YUMM1.7 or YUMMER1.7 tumour cells in a suspension of 1:1 PBS:Matrigel (Corning). When tumours were palpable, mice were randomized on a per-cage basis to anti-PD-1 (clone J43, Bio X Cell) or IgG (non-reactive polyclonal Armenian hamster, Bio X Cell), at a weight-adjusted dose (10 mg kg−1) administered intraperitoneally every 3 days until the end-point (16–24 days). Diet was continued for the duration of the experiment and tumours were monitored by manual calliper.
- 3.
Diet switch model: Diet switch experiments were performed at the GCI with 15-week-old male C57BL/6J mice purchased from Jackson Laboratories. Upon arrival, mice were fed the standard chow for 1 week during the acclimatization period and were then switched to either the High Fat diet or Psyllium diet for 3 weeks (ad libitum). After three weeks, mice were injected subcutaneously with 500,000 HKP1 tumour cells in a suspension of 1:1 PBS:Matrigel (Corning). When tumours were palpable, mice were randomized on a per-cage basis to anti-PD-1 (clone J43, Bio X Cell) or IgG (non-reactive polyclonal Armenian hamster, Bio X Cell), at a weight-adjusted dose (10 mg kg−1) administered intraperitoneally every 3 days until the end-point (21 days). Two days before the first treatment, the High Fat diet was switched to the Psyllium diet, and vice versa. The new diet was continued for the duration of the experiment and tumours were monitored by manual calliper.
- 4.
Antibiotic treatment (sustained during ICI treatment): Long-term antibiotic treatment experiments were performed at the GCI with 4-week-old male C57BL/6J mice purchased from Jackson Laboratories. Upon arrival, mice were fed the standard chow for 1 week during the acclimatization period and were then switched to a special diet for 15 weeks (ad libitum). After 12 weeks of being fed the Low Fat or High Fat diet, mice were administered antibiotics (1 mg ml−1 ampicillin (Sigma-Aldrich), 1 mg ml−1 neomycin (Fisher Scientific), 1 mg ml−1 gentamicin (Sigma-Aldrich), 1 mg ml−1 metronidazole (Sigma-Aldrich), 0.5 mg ml−1 vancomycin (Fisher Scientific)) in sterile drinking water ad libitum for the remainder of the experiment. The solution was replenished every 3–4 days, and bottles were changed weekly. After 15 weeks of special diet and 3 weeks of antibiotics, mice were injected subcutaneously with 500,000 HKP1 tumour cells in a suspension of 1:1 PBS:Matrigel (Corning). When tumours were palpable, mice were randomized on a per-cage basis to anti-PD-1 (clone J43, Bio X Cell) or IgG (non-reactive polyclonal Armenian hamster, Bio X Cell), at a weight-adjusted dose (10 mg kg−1) administered intraperitoneally every 3 days until the end-point (18 days). Tumours were monitored by manual calliper.
- 5.
Mouse-to-mouse FMT: Mouse-to-mouse FMT experiments were performed at the GCI with 15-week-old male C57BL/6J mice purchased from Jackson Laboratories. Mice were fed either a High Fat diet or Psyllium diet for the entire trial, beginning one week before antibiotics. Mice were administered antibiotics (1 mg ml−1 ampicillin (Sigma-Aldrich), 1 mg ml−1 neomycin (Fisher Scientific), 1 mg ml−1 gentamicin (Sigma-Aldrich), 1 mg ml−1 metronidazole (Sigma-Aldrich), 0.5 mg ml−1 vancomycin (Fisher Scientific)) in sterile drinking water ad libitum for 14 days. The solution was replenished every 3–4 days, and bottles were changed weekly. Two days after the mice were switched to regular autoclaved drinking water, fecal samples were collected from donor mice consuming the Psyllium diet and homogenized at a concentration of 1 fecal sample per ml of reduced PBS. One-hundred microlitres of suspension was used for oral gavage of each recipient mouse. Approximately 100 µl of solution was applied to the fur of each mouse. No-FMT control mice received 100 µl of PBS via oral gavage. This process was repeated weekly for the duration of each trial, for a total of five FMTs. 24 h after the second FMT, mice were injected subcutaneously with 500,000 HKP1 tumour cells in a suspension of 1:1 PBS:Matrigel (Corning). When tumours were palpable, mice were randomized on a per-cage basis to anti-PD-1 (clone J43, Bio X Cell) or IgG (non-reactive polyclonal Armenian hamster, Bio X Cell) at a weight-adjusted dose (10 mg kg−1) administered intraperitoneally every 3 days until the end-point (21 days). Tumours were monitored by manual calliper.
- 6.
Human-to-mouse FMT from high-BMI and low-BMI donors: Human-to-mouse FMTs were performed at the CRCHUM, with ethics approval for human sample collection (ethics no. C23046BR) and informed consent from patients. After 48 h of acclimatization, 6-week-old female wildtype C57BL/6J specific pathogen-free mice from Charles River received 3 days of antibiotics solution containing ampicillin (1 mg ml−1), streptomycin (5 mg ml−1) and colistin (1 mg ml−1; Sigma-Aldrich) in sterile drinking water and were fed standard chow. FMT, using faeces from patients with NSCLC (Supplementary Table 9), was performed by thawing fecal material, and 200 µl of the suspension (100 mg ml−1) was then transferred by oral gavage. An additional 100 µl was applied on the fur of each animal. Two weeks after FMT, mice were implanted subcutaneously with 800,000 MCA205 cells. When tumours were palpable, mice were randomized to anti-PD-1 (clone RMPI-14, Bio X Cell) or IgG (clone 2A3, Bio X Cell) at a fixed dose of 250 µg per mouse intraperitoneally every 3 days. Tumour growth was monitored by manual calliper.
- 7.
Human-to-mouse FMT from ICI-refractory patient: Human-to-mouse FMT was performed at the CRCHUM, using a human fecal sample (Supplementary Table 3) from the CHUM lung cancer biobank. Appropriate ethics approval was obtained at the CRCHUM in Montreal (ethics 17.035), with informed consent from the patient. After 48 h of acclimatization, 6-week-old female wildtype C57BL/6J specific pathogen-free mice from Charles River were fed the High Fat diet or the Psyllium diet with ad libitum access for the duration of the trial. 10 days after the start of the trial, an FMT using the patient’s faeces was performed by thawing fecal material, and 200 µl of the suspension (100 mg ml−1) was then transferred by oral gavage. An additional 100 µl was applied on the fur of each animal. Two weeks after FMT, mice were injected subcutaneously with 500,000 HKP1 cells. When tumours were palpable, mice were randomized to anti-PD-1 (clone RMPI-14, Bio X Cell) or IgG (clone 2A3, Bio X Cell) at a fixed dose of 250 µg per mouse intraperitoneally every 3 days. Tumour growth was monitored by manual calliper.
- 8.
Single-strain supplementation in specific pathogen-free mice: Single-strain supplementation experiments were performed at the CRCHUM. After 48 h of acclimatization, 6-week-old female wildtype C57BL/6J mice from Charles River were fed the High Fat diet ad libitum. After 11 days, mice received 3 days of antibiotics solution in sterile drinking water, containing ampicillin (1 mg ml−1), streptomycin (5 mg ml−1) and colistin (1 mg ml−1; Sigma-Aldrich). Mice were then injected subcutaneously with 500,000 HKP1 cells (resuspended in 1:1 Matrigel:PBS). Beginning on the day of tumour cell injection, oral gavage of 100 µl of bacterial suspension (L. johnsonii or M. gordoncarteri) or PBS were performed every 3 days until the end-point. When tumours were palpable, mice were randomized to anti-PD-1 (clone RMPI-14, Bio X Cell) or IgG (clone 2A3, Bio X Cell) at a fixed dose of 250 µg per mouse intraperitoneally every 3 days. Tumour growth was monitored by manual calliper.
- 9.
Monocolonization in germ-free mice: Germ-free 7- to 10-week-old female C57BL/6J mice were purchased from the International Microbiome Centre Germ-Free Facility (University of Calgary) and maintained at the CRCHUM germ-free animal facility. Mice were housed in sterile individual ventilated cages at 21–23 °C, 40–60% humidity on a 12 h:12 h light:dark cycle. Mice had free access to water and food (Teklad Global 2918). Mice were housed in sealed positive pressure IVC (Sentry SPP) in an exclusive holding room with the same environmental parameters described above. After 48 h of acclimatization, mice were fed double-irradiated High Fat diet (D12492-1.5V, Research Diets) or Psyllium diet (D21021104B-1.5V, Research Diets) with ad libitum access to food. After 2 weeks, mice were implanted with 500,000 HKP1 cells or 800,000 MCA205 cells (resuspended in 1:1 Matrigel:PBS). Beginning on the day of tumour cell injection, an oral gavage of 200 µl of bacterial suspension (L. johnsonii or M. gordoncarteri at OD 1) or PBS were performed every 3 days until the end-point. When tumours were palpable, mice were treated with anti-PD-1 (clone RMPI-14, Bio X Cell) or IgG (clone 2A3, Bio X Cell) at a fixed dose of 250 µg per mouse intraperitoneally every 3 days. Tumour sizes were measured with a manual calliper. The tumour cells were manipulated in a clean environment under a biological hood and tested negative for mycoplasma. The tubes containing the tumour cells, the bacteria suspension, and the anti-PD-1 or isotype control were sterilized with a cold sterilant and directly transferred under the hood where the mice were manipulated. The callipers were first sterilized in an autoclave at 132 °C for 20 min. At the time of the experiment, a second sterilization was performed, during which the sterilization pouches containing the callipers were sterilized with a cold sterilant and directly transferred under the hood where the mice were manipulated. After the measurement was performed, the calliper was placed on the steel grid inside the cage to remain sterile for subsequent measurements.
- 10.
DAT supplementation in vivo: DAT supplementation experiments were performed at the GCI with 11-week-old male C57BL/6J mice from the in-house colony. Sterilized DAT drinking water solution was prepared using 100 mM 3-(4-Hydroxyphenyl)-propionic acid (DAT, Sigma-Aldrich) in autoclaved water neutralized with NaOH. Following the 3-week tumour model with the Psyllium diet, mice were administered DAT-supplemented drinking water beginning on the day of tumour injection. Mice were injected subcutaneously with 500,000 HKP1 tumour cells in a suspension of 1:1 PBS:Matrigel (Corning). When tumours were palpable, mice were randomized on a per-cage basis to anti-PD-1 (clone J43, Bio X Cell) or IgG (non-reactive polyclonal Armenian hamster, Bio X Cell), at a weight-adjusted dose (10 mg kg−1) administered intraperitoneally every 3 days until the end-point (day 20). Diet and DAT-water were continued for the duration of the experiment and tumours were monitored by manual calliper.
Body composition analysis
Body weight was monitored weekly for the duration of all trials. Body composition (lean and fat mass) was assessed after 13 weeks of diet using Echo MRI-100 body composition analyser (EchoMRI LLC). Body composition measurements (% lean and % fat mass) were calculated on the basis of body weight for each mouse
Glucose tolerance test
During the 14th week of diet feeding, mice were fasted for 6 h in cages with wood shavings. Fasting glucose levels were measured with OneTouch UltraMini blood glucose meter from tail vein blood. Twenty per cent glucose solution was then administered. Blood glucose levels were measured at 0, 30, 60, 90 and 120 min, and results reported as AUC
Serum hormone analysis
Blood was collected 10 min at 15 000 rpm, and serum was transferred to fresh tubes and stored at −80 °C for subsequent analysis. Serum insulin and leptin levels were quantified using quantitative sandwich enzyme-linked immunosorbent assay (ELISA) using reagents from Crystal Chem in the laboratory of M.P
Metabolic score calculation
To generate a metabolic score for each mouse, we integrated key indicators of metabolic health: body weight (a core measure of obesity), fat mass (body composition), glucose tolerance test results (glucose metabolism), and serum insulin levels (marker of metabolic dysfunction). For each parameter, individual values were normalized using the formula:
$$begin{array}{l}{rm{normalized; value}}\ ,=,(x-{rm{m}}{rm{i}}{rm{n}}{rm{i}}{rm{m}}{rm{u}}{rm{m}},{rm{v}}{rm{a}}{rm{l}}{rm{u}}{rm{e}})/({rm{m}}{rm{a}}{rm{x}}{rm{i}}{rm{m}}{rm{u}}{rm{m}},{rm{v}}{rm{a}}{rm{l}}{rm{u}}{rm{e}}-{rm{m}}{rm{i}}{rm{n}}{rm{i}}{rm{m}}{rm{u}}{rm{m}},{rm{v}}{rm{a}}{rm{l}}{rm{u}}{rm{e}})end{array}$$
where x represents the individual measurement (for example, 30 g for body weight). If data were missing (for example, insulin levels only measured in n = 5 mice per diet group), the missing values were imputed using the group average for that metric. Each normalized parameter was then weighted: body weight and fat mass contributed 30% each, while GTT and insulin levels contributed 20% each. The final metabolic score was calculated as the sum of the weighted, normalized values, resulting in a composite score ranging from 0 to 1.
ICI sensitivity score calculation
An ICI sensitivity score for each anti-PD-1-treated mouse was calculated using the following formula:
$${rm{I}}{rm{C}}{rm{I}},{rm{s}}{rm{c}}{rm{o}}{rm{r}}{rm{e}}=((x-y)/{rm{s.d.}}(y))times -1$$
where x represents the end-point tumour volume of the anti-PD-1-treated mouse and y corresponds to the average tumour volume of the IgG group at the end-point for a given diet
Tissue processing and spectral flow cytometry
Tumours were collected, mechanically dissociated and filtered through a 40 µm mesh filter. Red blood cell lysis was performed using BD Pharm Lyse solution (BD Biosciences), with three rounds for whole blood samples and one round for tumour samples. Tumour samples were enriched for leukocytes using Percoll centrifugation, pH 8.5–9.5 (25 °C) (Sigma-Aldrich). Cells were incubated with Zombie viability dye (1:1,000 in PBS) for 30 min at room temperature (ThermoFisher Scientific). After washing, cells were incubated with Fc block (1:100 in FACS buffer (2% FBS in PBS)) (BD Biosciences) for 30 min at 4 °C. After washing, cells were incubated with fluorescent-conjugated antibodies (Supplementary Table 11) in FACS buffer and Brilliant Stain buffer (ThermoFisher Scientific) for 30 min at 4 °C. Cells were then washed and were fixed using the Foxp3/Transcription Factor Staining buffer set (45 min at 4 °C) (ThermoFisher Scientific). Cells were washed with 1× Permeabilization buffer (ThermoFisher Scientific) and incubated with antibodies in Permeabilization buffer for intracellular staining (30 min at 4 °C). Cells were then washed with FACS buffer. Samples were acquired using Cytek Aurora. OneComp eBeads (eBioscience) or splenocytes were used for compensation controls. Dead cells and debris were excluded from analysis using forward scatter x side scatter and Live/Dead stain. FlowJo.V 10.8.0 was used for analysis. Representative gating strategy can be found in Extended Data Fig. 12.
Ex vivo stimulation of tumour-infiltrating T cells
Tumours were collected, mechanically dissociated and filtered through a 40 µm mesh filter. Red blood cell lysis was performed using ACK lysis buffer (Gibco). Tumour samples were enriched for leukocytes using Percoll centrifugation, pH 8.5–9.5 (25 °C) (Sigma-Aldrich). T cells were isolated using the EasySep Mouse T cell Isolation Kit (STEMCELL) and cultured for 3 h in RPMI-1640 supplemented with 10% FBS. Cells were stimulated with PMA (25 ng ml−1), ionomycin (1 μg ml−1) and 1× brefeldin A (BFA). Where applicable, neutralized 1 mM DAT (Sigma-Aldrich) was prepared using sterile water and NaOH and added to the culture medium. After 3 h, flow cytometry was performed as described above.
Ex vivo T cell activation and indole stimulation
Spleens were collected from wildtype C57BL/6J mice, mechanically dissociated, and passed through a 40 µm mesh filter to obtain single-cell suspensions. Red blood cells were lysed using ACK lysis buffer (Gibco). Splenocytes were resuspended in complete T cell media (RPMI-1640 supplemented with 10% FBS, 2% non-essential amino acids, 0.001% β-mercaptoethanol, 2 mM l-glutamine, 20 mM HEPES, and 1 mM sodium pyruvate) and plated in triplicate at 2.5 million cells per ml in a plate pre-coated with anti-CD3 (BioLegend) and anti-CD28 (BioLegend) antibodies (final concentration: 3 µg ml−1 each) for 24 h. Recombinant IL-2 (30 ng ml−1) was added at the time of plating. Media was supplement with 500 µM ILA (Millipore Sigma), indoleacetic acid (Millipore Sigma), indolepyruvic acid (Millipore Sigma) or indolepropionic acid (Millipore Sigma). BFA was added during the final 3 h of culture to allow intracellular cytokine detection. After 24 h of activation, cells were collected and analysed by flow cytometry as described above.
Ex vivo T cell activation and fecal homogenate stimulation
CD8+ T cells were isolated from spleens as described above using the EasySep Mouse Naïve CD8+ T cell Isolation Kit (STEMCELL). Fecal pellets were homogenized in PBS on ice to a final concentration of 50 mg ml−1. The resulting slurry was centrifuged at 1,000g for 15 min at 4 °C and the supernatant was sequentially filtered through a pre-wetted 40 µm filter, 0.45 µm filter and 0.22 µm syringe filter to ensure sterility and minimize metabolite loss. For experimental treatments, fecal supernatant was added to CD8+ T cell cultures at a final concentration of 2.5% (v/v) in T cell media. Cells were incubated for 72 h in the presence of activation antibodies (plate-bound anti-CD3 and anti-CD28) and recombinant IL-2 (30 ng ml−1), as described above. Where applicable, neutralized 1 mM DAT (Sigma-Aldrich) was prepared using sterile water and NaOH and added to the culture medium. Following incubation, cells were stimulated for 3 h with PMA, ionomycin and BFA, as described above before performing antibody staining for flow cytometry.
DNA extraction and bacterial 16S rRNA gene sequencing
Within experiments subject to 16S rRNA gene sequencing, fecal samples from a representative subset of mice were used (therefore 16S rRNA gene sequencing n values may not exactly match experimental n values). Fresh fecal samples were collected in Eppendorf tubes and kept on ice before storing at −80 °C until DNA extraction. The 515F (GTGYCAGCMGCCGCGGTAA)–806R (GGACTACNVGGGTWTCTAAT) primer set was used for amplification as described60,61. Amplicons were sequenced on the Illumina MiSeq V3 platform (2 × 250 bp paired-end reads). Samples from initial characterization experiments were processed at the McGill Genome Centre and functional FMT experiment samples were processed at AZENTA. Reagent controls were confirmed below the detection limit for quality assurance. Paired-end reads were processed using the nf-core/ampliseq pipeline (v2.14.0) of the nf-core collection of workflows62,63, utilizing reproducible software environments from the Bioconda64 and Biocontainers65 projects. Data quality was evaluated with FastQC66 and summarized with MultiQC67. Cutadapt68 retrimmed primers and all untrimmed sequences were discarded. Sequences that did not contain primer sequences were considered artifacts. Adapter and primer-free sequences were processed sample-wise (independently) with DADA2 (ref. 69) to eliminate PhiX contamination, trim reads, discard reads with >2 expected errors, correct errors, merge read pairs, and remove PCR chimeras. Taxonomic classification was performed by DADA2 and the Silva 138.2 prokaryotic SSU database70. The resulting ASV abundance and corresponding taxonomic assignment files were then analysed using the Microbiome Analyst Tool as previously described71. In brief, data integrity analysis was performed in which features with zero values across all samples were considered artifacts and removed. Very low count samples were excluded. All analyses were performed on data either rarefied to a minimum of 10,000 reads or normalized using total sum scaling as applicable for the dataset. Non-parametric t-tests were performed to determine differences in bacterial taxa occurrence between fecal bacterial communities. PCoA ordination was generated at the ASV level using the Bray–Curtis distance metric to visually compare beta diversity. PERMDISP analysis was used to assess group variances while analysis of similarity (ANOSIM) or PERMANOVA test statistics was performed to statistically compare within- to between- group differences.
Quantitative PCR
Mouse fecal samples were stored in Eppendorf tubes at −80 °C until use. Genomic DNA was extracted from the fecal samples using the NucleoMag DNA Microbiome kit according to manufacturer’s instructions (Takara Bio). DNA was quantified using the Qubit 4 Fluorometer and Qubit 1× dsDNA Broad Range Assay Kits (Invitrogen). Purity of DNA was assessed by microvolume spectrophotometry (NanoDrop 2000, Thermo Scientific). The QuantStudio 6 Flex Real-Time PCR System was used with the PowerUp SYBR Green Master Mix (Applied Biosystems) with the following thermocycling parameters: initial denaturation of 95 °C for 3 min and 40 cycles of 95 °C for 10 s and annealing and extension at 60 °C for 30 s, followed by melt curve analysis from 65 °C to 95 °C in 0.5 °C increments. Target bacterial genes were quantified using calibration quantification to estimate the number of copies per target per ng input DNA.
Lactobacillus spp. primers72: forward, LactoF: 5′-GAGGCAGCAGTAGGGAATCTTC-3’; reverse, LactoR: 5′-GGCCAGTTACTACCTCTATCCTTCTTC-3′. Bacteroides spp. primers73: forward, BactF: 5′-CGATGGATAGGGGTTCTGAGAGGA-3′; reverse, BactR: 5′-GCTGGCACGGAGTTAGCCGA-3′. L. johnsonii primers (designed in this study): forward, L. johnsoniiF: 5′-AAACAGATGCTAATACCGGATA-3′; reverse, L. johnsoniiR: 5′-ACTAGCTAATGCACCGCAGG-3′
Metagenomics
Within experiments subject to metagenomics, fecal samples from a representative subset of mice were used (therefore metagenomics n values may not exactly match experimental n values). Fresh fecal samples were collected in Eppendorf tubes and kept on ice before storing at −80 °C until DNA extraction. Genomic DNA was extracted from the fecal samples using the NucleoMag DNA Microbiome kit according to manufacturer’s instructions (Takara Bio). DNA was quantified using the Qubit 4 Fluorometer and Qubit 1× dsDNA Broad Range Assay Kits (Invitrogen). Purity of DNA was assessed by microvolume spectrophotometry (NanoDrop 2000, Thermo Scientific). DNA library preparations and sequencing reactions were conducted at AZENTA. NEB NextUltra DNA Library Preparation kit was used following the manufacturer’s recommendations (Illumina). In brief, the genomic DNA was fragmented by acoustic shearing with a Covaris S220 instrument. The DNA was end repaired and adenylated. Adapters were ligated after adenylation of the 3′ ends. Adapter-ligated DNA was indexed and enriched by limited cycle PCR. The DNA libraries were validated using TapeStation (Agilent Technologies) and quantified using Qubit 2.0 Fluorometer and by real-time PCR (Applied Biosystems). The DNA libraries were loaded on an Illumina NovaSeq S4 or equivalent according to manufacturer’s instructions (Illumina). Sequencing was performed using a 2× 150 paired-end configuration; image analysis and base calling was conducted by the Control Software on the instrument. Bcl files were converted to fastq files and demultiplexed using bcl2fastq v2.17. Reads were processed using the Kraken2 pipeline as previously described74,75 and the resulting count and taxonomy files were analysed using the Microbiome Analyst tool as described above. For beta diversity and SIMPER analyses of the microbiota of responsive and non-responsive mice, ordination and biplot visualization was performed in R v4.2.3 for macOS using the vegan, ggplot2 and ggrepel packages.
Bacteria culture and preparation
L. johnsonii and L. gasseri were isolated from a patient with NSCLC and a smoker undergoing cancer screening, respectively (ethics no. MP-02-2018-7132/17.035). M. gordoncarteri was purchased from the Leibniz Institute DSMZ. Bacteria were cultured from frozen stocks on fastidious anaerobe agar plates (Fisher Scientific) for 48 h at 37 °C under anaerobic conditions. Prior to each oral gavage, the identity of each isolate was confirmed by MALDI–TOF mass spectrometry. Following identification, bacterial colonies were collected, resuspended in sterile NaCl, and adjusted to an optical density (OD) of 1.0, corresponding to approximately 1 × 10⁹ colony-forming units per ml.
Metabolomics analysis on mouse serum, human plasma and bacterial supernatant
Serum metabolomics was performed on mouse blood samples from germ-free models (collected at the end-point) and top 4 ICI R versus NR diet models (High Fat, Aspartame, American, Inulin versus Psyllium, Mediterranean, Japanese, Ketogenic; collected at 13 weeks), which included obesogenic R versus NR diets (High Fat, American versus Ketogenic, Mediterranean). Blood was collected via submandibular puncture with a Goldenrod animal lancet into Eppendorf tubes. Samples were centrifuged for 10 min at 15,000 rpm, and serum was transferred to fresh tubes and stored at −80 °C for subsequent analysis. Human blood samples were obtained from the lung cancer biobank at the CRCHUM (ethics no. 17.035), which received informed consent from patients. Blood was collected in heparin-coated tubes followed by processing for plasma isolation, and storage at −80 °C. Bacterial suspensions were centrifuged at 3,000 rpm for 15 min at 4 °C followed by 0.2 µm filtration. All samples were analysed by The Metabolomics Innovation Centre (TMIC, University of Alberta): Multi-channel high-performance chemical isotope labelling liquid chromatography–mass spectrometry (HP-CIL LC–MS) based metabolomics analysis was performed76. For mouse serum (R/NR diet samples) and human plasma samples, two-channel analysis, targeting amine/phenol- and carboxyl-containing metabolites, were conducted. For bacterial supernatants and germ-free mouse serum samples, one-channel analysis targeting amine/phenol submetabolome was carried out. Samples were randomized before any procedures to eliminate any potential batch variations in sample analysis. Sample preparation was performed using the chemical isotope labelling kits (NMT-4101-KT and NMT-4167-KT, Nova Medical Testing). Data were acquired by Thermo Scientific Vanquish LC system coupled to a Bruker Impact II QTOF mass spectrometer. Mobile phase A was 0.1% (v/v) formic acid in water and mobile phase B was 0.1% (v/v) formic acid in acetonitrile. The gradient setting was: t = 0 min, 25% B; t = 10 min, 99% B; t = 15 min, 99% B; t = 15.1 min, 25% B; t = 18 min, 25%. All raw data were processed in IsoMS Pro 1.4.0 (Nova Medical Testing). Data were normalized via the ratio of total useful signal method76,77. Hierarchical metabolite identification was performed using the NovaMT Database v3.0 (Nova Medical Testing) by matching features to authentic chemical standards (tier 1), pathway-associated entries (tier 2), or accurate mass networks within the MyCompoundID database (tier 3), retaining only tier 1 and tier 2 as high-confidence annotations for downstream analysis. MetaboAnalyst 6.0 (refs. 78,79) was used for pathway enrichment and multivariate analyses of high-confidence results using the final metabolite intensity tables provided by TMIC (Supplementary Tables 4–7).
Statistics and reproducibility
GraphPad Prism (v10.6.1) was used for data analysis. Data are presented as mean ± s.e.m. unless otherwise indicated. For all experiments, the statistical test used is indicated in the figure legends. For all tumour growth curves, multiple two-tailed Mann–Whitney tests were used. For other quantitative analyses, normality was first assessed using the Shapiro–Wilk test. Data that passed the normality tests were analysed by Student’s t-test for two groups, or ordinary one-way ANOVA for more than two groups. Dunnett’s multiple comparisons test was used when comparing results to the Low Fat diet control. For data that failed the normality test, Mann–Whitney tests were used for two groups, or Kruskal–Wallis for more than two groups. The LEfSe workflow included a Kruskal–Wallis test to determine significance. All correlations were determined by Spearman’s correlation. Sample size was determined by historical data (not by power calculation). Randomization was done on a per-cage basis. Blinding was not possible due to differences in mouse size and diet colour. Experiments were independently repeated as indicated in the corresponding figure legends and the Reporting Summary. Replication across separate animal cohorts, cages, facilities, cell lines and experimental conditions successfully yielded similar results. For longitudinal gut microbiome analyses, samples from two separate cages were included to consider inter-cage variation. However, treatment groups were maintained in separate cages following tumour injection. For all tumour models, unless otherwise indicated, each cage co-housed n = 5 mice for a given diet. Note that some tumour-bearing mice were euthanized before the trial end-point due to humane end-points (see ‘Animal ethics statement’) and were excluded from subsequent end-point analyses; however, these mice may have been included in baseline model characterization prior to tumour implantation, resulting in seemingly discordant n values. For clarity, n values for model characterization experiments in which multiple tiers of data were generated can be found in Supplementary Table 12.
Reporting summary
Further information on research design is available in the Nature Portfolio Reporting Summary linked to this article
Data availability
The 16S rRNA gene amplicon sequencing and shotgun metagenomic sequencing data generated in this study have been deposited in the NCBI Sequence Read Archive under BioProject accession PRJNA1468761. All other data are available upon reasonable request
References
Simpson, R. C., Shanahan, E. R., Scolyer, R. A. & Long, G. V. Towards modulating the gut microbiota to enhance the efficacy of immune-checkpoint inhibitors. Nat. Rev. Clin. Oncol.20, 697–715 (2023)
McQuade, J. L. et al. Association of body-mass index and outcomes in patients with metastatic melanoma treated with targeted therapy, immunotherapy, or chemotherapy: a retrospective, multicohort analysis. Lancet Oncol.19, 310–322 (2018)
Cortellini, A. et al. A multicenter study of body mass index in cancer patients treated with anti-PD-1/PD-L1 immune checkpoint inhibitors: when overweight becomes favorable. J. Immunother. Cancer7, 57 (2019)
Kichenadasse, G. et al. Association between body mass index and overall survival with immune checkpoint inhibitor therapy for advanced non-small cell lung cancer. JAMA Oncol.6, 512–518 (2020)
Wang, Z. et al. Paradoxical effects of obesity on T cell function during tumor progression and PD-1 checkpoint blockade. Nat. Med.25, 141–151 (2019)
An, Y. et al. Association between body mass index and survival outcomes for cancer patients treated with immune checkpoint inhibitors: a systematic review and meta-analysis. J. Transl. Med.18, 235 (2020)
Jose, D. G. & Good, R. A. Quantitative effects of nutritional protein and calorie deficiency upon immune responses to tumors in mice. Cancer Res.33, 807–812 (1973)
CAS
PubMed
Google ScholarWu, G. D. et al. Linking long-term dietary patterns with gut microbial enterotypes. Science334, 105–108 (2011)
Asnicar, F. et al. Microbiome connections with host metabolism and habitual diet from 1,098 deeply phenotyped individuals. Nat. Med.27, 321–332 (2021)
Elkrief, A. et al. The gut microbiome as a target in cancer immunotherapy: opportunities and challenges for drug development. Nat. Rev. Drug. Discov.24, 685–704 (2025)
Collins, N. & Belkaid, Y. Control of immunity
Asnicar, F. et al. Gut micro-organisms associated with health, nutrition and dietary interventions. Nature650, 450–458 (2026)
NCD Risk Factor Collaboration (NCD-RisC) Worldwide trends in underweight and obesity from 1990 to 2022: a pooled analysis of 3663 population-representative studies with 222 million children, adolescents, and adults. Lancet403, 1027–1050 (2024)
Graham, A. L. Naturalizing mouse models for immunology. Nat. Immunol.22, 111–117 (2021)
Speakman, J. R. Use of high-fat diets to study rodent obesity as a model of human obesity. Int. J. Obes.43, 1491–1492 (2019)
Barrington, W. T. et al. Improving metabolic health through precision dietetics in mice. Genetics208, 399–417 (2018)
Kunkemoeller, B. et al. The. Nat. Metab.7, 1630–1645 (2025)
Kumar, A. et al. Postprandial lipid metabolism durably enhances T cell immunity. Naturehttps://doi.org/10.1038/s41586-026-10432-8 (2026)
Sotak, M., Clark, M., Suur, B. E. & Borgeson, E. Inflammation and resolution in obesity. Nat. Rev. Endocrinol.21, 45–61 (2025)
McDowell, S. A. C. Obesity alters monocyte developmental trajectories to enhance metastasis. J. Exp. Med.https://doi.org/10.1084/jem.20220509 (2023)
Sorin, M. Single-cell spatial landscape of immunotherapy response reveals mechanisms of CXCL13 enhanced antitumor immunity. J. Immunother. Cancerhttps://doi.org/10.1136/jitc-2022-005545 (2023)
Wang, J. et al. Body mass index and mortality in lung cancer patients: a systematic review and meta-analysis. Eur. J. Clin. Nutr.72, 4–17 (2018)
Calle, E. E., Rodriguez, C., Walker-Thurmond, K. & Thun, M. J. Overweight, obesity, and mortality from cancer in a prospectively studied cohort of U.S. adults. N. Engl. J. Med.348, 1625–1638 (2003)
Jiang, M. et al. The relationship between body-mass index and overall survival in non-small cell lung cancer by sex, smoking status, and race: a pooled analysis of 20,937 International lung Cancer consortium (ILCCO) patients. Lung Cancer152, 58–65 (2021)
Lam, V. K. et al. Obesity is associated with long-term improved survival in definitively treated locally advanced non-small cell lung cancer (NSCLC). Lung Cancer104, 52–57 (2017)
Petrelli, F. et al. Association of obesity with survival outcomes in patients with cancer: a systematic review and meta-analysis. JAMA Netw. Open4, e213520 (2021)
Quail, D. F. et al. Obesity alters the lung myeloid cell landscape to enhance breast cancer metastasis through IL5 and GM-CSF. Nat. Cell Biol.19, 974–987 (2017)
McDowell, S. A. C. et al. Neutrophil oxidative stress mediates obesity-associated vascular dysfunction and metastatic transmigration. Nat. Cancer2, 545–562 (2021)
Clements, V. K. et al. High fat diet and leptin promote tumor progression by inducing myeloid-derived suppressor cells. J. Leukoc. Biol.103, 395–407 (2018)
David, L. A. et al. Diet rapidly and reproducibly alters the human gut microbiome. Nature505, 559–563 (2014)
Link, V. M. et al. Differential peripheral immune signatures elicited by vegan versus ketogenic diets in humans. Nat. Med.30, 560–572 (2024)
Le Chatelier, E. et al. Richness of human gut microbiome correlates with metabolic markers. Nature500, 541–546 (2013)
Peters, B. A. et al. A taxonomic signature of obesity in a large study of American adults. Sci. Rep.8, 9749 (2018)
Schulz, M. D. et al. High-fat-diet-mediated dysbiosis promotes intestinal carcinogenesis independently of obesity. Nature514, 508–512 (2014)
Matson, V. et al. The commensal microbiome is associated with anti-PD-1 efficacy in metastatic melanoma patients. Science359, 104–108 (2018)
Peng, Z. et al. The gut microbiome is associated with clinical response to anti-PD-1/PD-L1 immunotherapy in gastrointestinal cancer. Cancer Immunol. Res.8, 1251–1261 (2020)
Katayama, Y. et al. The role of the gut microbiome on the efficacy of immune checkpoint inhibitors in Japanese responder patients with advanced non-small cell lung cancer. Transl. Lung Cancer Res.8, 847–853 (2019)
Mager, L. F. et al. Microbiome-derived inosine modulates response to checkpoint inhibitor immunotherapy. Science369, 1481–1489 (2020)
Bender, M. J. et al. Dietary tryptophan metabolite released by intratumoral Lactobacillus reuteri facilitates immune checkpoint inhibitor treatment. Cell186, 1846–1862.e1826 (2023)
Routy, B. et al. Fecal microbiota transplantation plus anti-PD-1 immunotherapy in advanced melanoma: a phase I trial. Nat. Med.29, 2121–2132 (2023)
Kargl, J. et al. Neutrophil content predicts lymphocyte depletion and anti-PD1 treatment failure in NSCLC. JCI Insight4, e130850 (2019)
Kim, I. S. et al. Immuno-subtyping of breast cancer reveals distinct myeloid cell profiles and immunotherapy resistance mechanisms. Nat. Cell Biol.21, 1113–1126 (2019)
Kim, K. H. et al. The first-week proliferative response of peripheral blood PD-1+CD8+ T cells predicts the response to anti-PD-1 therapy in solid tumors. Clin. Cancer Res.25, 2144–2154 (2019)
Miller, B. C. et al. Subsets of exhausted CD8+ T cells differentially mediate tumor control and respond to checkpoint blockade. Nat. Immunol.20, 326–336 (2019)
Baruch, E. N. et al. Fecal microbiota transplant promotes response in immunotherapy-refractory melanoma patients. Science371, 602–609 (2021)
Davar, D. et al. Fecal microbiota transplant overcomes resistance to anti-PD-1 therapy in melanoma patients. Science371, 595–602 (2021)
Duttagupta, S. et al. Fecal microbiota transplantation plus immunotherapy in non-small cell lung cancer and melanoma: the phase 2 FMT-LUMINate trial. Nat. Med.32, 1337–1350 (2026)
Zhang, Q. et al. Lactobacillus plantarum-derived indole-3-lactic acid ameliorates colorectal tumorigenesis, 943–960 e949 (2023)
Steed, A. L. et al. The microbial metabolite desaminotyrosine protects from influenza through type I interferon. Science357, 498–502 (2017)
Thomas, S. et al. Desaminotyrosine contributes to the anticancer effect of fecal microbial transplantation during immune checkpoint blockade in mice and patients. Cancer Res.85, 1173 (2025)
Joachim, L. et al. The microbial metabolite desaminotyrosine enhances T-cell priming and cancer immunotherapy with immune checkpoint inhibitors. eBiomedicine97, 104834 (2023)
Kawanabe-Matsuda, H. et al. Dietary Lactobacillus-derived exopolysaccharide enhances immune-checkpoint blockade therapy. Cancer Discov.12, 1336–1355 (2022)
Jia, D. et al. Microbial metabolite enhances immunotherapy efficacy by modulating T cell stemness in pan-cancer. Cell187, 1651–1665.e1621 (2024)
Sivan, A. et al. Commensal Bifidobacterium promotes antitumor immunity and facilitates anti-PD-L1 efficacy. Science350, 1084–1089 (2015)
Bessell, C. A. et al. Commensal bacteria stimulate antitumor responses
Fluckiger, A. et al. Cross-reactivity between tumor MHC class I-restricted antigens and an enterococcal bacteriophage. Science369, 936–942 (2020)
Kennedy, M. S. et al. Diet outperforms microbial transplant to drive microbiome recovery in mice. Nature642, 747–755 (2025)
Conforti, F. et al. Cancer immunotherapy efficacy and patients’ sex: a systematic review and meta-analysis. Lancet Oncol.19, 737–746 (2018)
Naik, G. S. et al. Complex inter-relationship of body mass index, gender and serum creatinine on survival: exploring the obesity paradox in melanoma patients treated with checkpoint inhibition. J. Immunother. Cancer7, 89 (2019)
Parada, A. E., Needham, D. M. & Fuhrman, J. A. Every base matters: assessing small subunit rRNA primers for marine microbiomes with mock communities, time series and global field samples. Environ. Microbiol.18, 1403–1414 (2016)
Apprill, A., McNally, S. P., Parsons, R. J. & Weber, L. Minor revision to V4 region SSU rRNA 806R gene primer greatly increases detection of SAR11 bacterioplankton. Aquat.Microb. Ecol.75, 129–137 (2015)
Ewels, P. A. et al. The nf-core framework for community-curated bioinformatics pipelines. Nat. Biotechnol.38, 276–278 (2020)
Straub, D. et al. Interpretations of environmental microbial community studies are biased by the selected 16S rRNA (gene) amplicon sequencing pipeline. Front. Microbiol.11, 550420 (2020)
Gruning, B. et al. Bioconda: sustainable and comprehensive software distribution for the life sciences. Nat. Methods15, 475–476 (2018)
da Veiga Leprevost, F. et al. BioContainers: an open- Bioinformatics33, 2580–2582 (2017)
Andrews, S. FastQC: a quality control tool for high throughput sequence data. Babraham Bioinformaticshttps://www.bioinformatics.babraham.ac.uk/projects/fastqc/ (2010)
Ewels, P., Magnusson, M., Lundin, S. & Kaller, M. MultiQC: summarize analysis results for multiple tools and samples in a single report. Bioinformatics32, 3047–3048 (2016)
Martin, M. et al. Cutadapt removes adapter sequences from high-throughput sequencing reads EMBNet.journal. EMBNet.journalhttps://doi.org/10.14806/ej.17.1.200 (2011)
Callahan, B. J. et al. DADA2: high-resolution sample inference from Illumina amplicon data. Nat. Methods13, 581–583 (2016)
Quast, C. et al. The SILVA ribosomal RNA gene database project: improved data processing and web-based tools. Nucleic Acids Res.41, D590–D596 (2013)
Lu, Y. et al. MicrobiomeAnalyst 2.0: comprehensive statistical, functional and integrative analysis of microbiome data. Nucleic Acids Res.51, W310–W318 (2023)
Delroisse, J. M. et al. Quantification of Bifidobacterium spp. and Lactobacillus spp. in rat fecal samples by real-time PCR. Microbiol. Res.163, 663–670 (2008)
Bergstrom, A. et al. Introducing GUt low-density array (GULDA): a validated approach for qPCR-based intestinal microbial community analysis. FEMS Microbiol. Lett.337, 38–47 (2012)
Wood, D. E. & Salzberg, S. L. Kraken: ultrafast metagenomic sequence classification using exact alignments. Genome Biol.15, R46 (2014)
Wood, D. E., Lu, J. & Langmead, B. Improved metagenomic analysis with Kraken 2. Genome Biol.20, 257 (2019)
Zhao, S., Li, H., Han, W., Chan, W. & Li, L. Metabolomic coverage of chemical-group-submetabolome analysis: group classification and four-channel chemical isotope labeling LC–MS. Anal. Chem.91, 12108–12115 (2019)
Wu, Y. & Li, L. Sample normalization methods in quantitative metabolomics. J. Chromatogr. A1430, 80–95 (2016)
Xia, J., Psychogios, N., Young, N. & Wishart, D. S. MetaboAnalyst: a web server for metabolomic data analysis and interpretation. Nucleic Acids Res.37, W652–660 (2009)
Pang, Z. et al. MetaboAnalyst 6.0: towards a unified platform for metabolomics data processing, analysis and interpretation. Nucleic Acids Res.52, W398–W406 (2024)
Acknowledgements
We thank all members of the Routy, Walsh and Quail laboratories for their input on this manuscript. We acknowledge core facility support from the Goodman Cancer Institute, Life Sciences Complex and McGill University, including the Flow Cytometry core facility (J. Leconte and C. Stegen), the Comparative Medicine and Animal Resource Centre, and the McGill Genome Centre (P. Jandaghi, C. Faubert, E. Gonzalez, D. Perley and A. Paccard), as well as the germ-free facility at the Centre de recherche du Centre hospitalier de l’Université de Montréal. We thank The Metabolomics Innovation Centre at the University of Alberta (Liang Li node) for their contributions to the metabolomics analysis. We thank L. Kazak (A. Roesler and C. Dykstra) for assisting with EchoMRI and I. King (B. Thurairajah) for sharing FMT protocols.
Funding
The authors acknowledge funding from La Vie en Rose (D.F.Q.), The Bachynski Family Foundation (L.A.W.), the Canada Foundation for Innovation JELF programme (D.F.Q. and L.A.W.) and Innovation Fund (42884), Canadian Institutes of Health Research (CIHR; PJT-178306, PJT-205821, D.F.Q. and CIHR PJT-191784, L.A.W.), Canadian Cancer Society (CCS; 707387, D.F.Q.; supported by the Lotte and John Hecht Memorial Foundation), the Terry Fox Research Institute (D.F.Q.) and TRANSCAN-3 (jointly supported by CIHR TRN-184696 and CCS 707710). L.D. acknowledges support from the CIHR Doctoral Fellowship programme. A.S. is supported by a Canadian Cancer Society Doctoral Research Training Award, in partnership with the Terry Fox Research Institute (CCS award 708356/TFRI award 1152-02). D.F.Q. holds a Tier II Canada Research Chair in Tumour Microenvironment research. L.A.W. holds a Rosalind Goodman Chair in Lung Cancer Research. B.R. is supported by the Seerave Foundation, and the FRQS Clinician Scientist Award. A.E. is supported by the Seerave Foundation, and the FRQS Clinician Scientist Award.
Author information
Authors and Affiliations
Rosalind and Morris Goodman Cancer Institute, McGill University, Montreal, Quebec, Canada
Lysanne Desharnais, Anikka Swaby, Samuel Doré, Miranda W. Yu, Benoit Fiset, Valérie Breton, Liam Wilson, Mark Sorin, Logan A. Walsh & Daniela F. Quail
Department of Human Genetics, McGill University, Montreal, Quebec, Canada
Lysanne Desharnais, Samuel Doré, Liam Wilson, Mark Sorin, Ken Dewar & Logan A. Walsh
Department of Medicine, Division of Experimental Medicine, McGill University, Montreal, Quebec, Canada
Anikka Swaby & Daniela F. Quail
Research Centre of the Centre Hospitalier de l’Université de Montréal, Montreal, Quebec, Canada
Meriem Messaoudene, Mayra Ponce, Yongjia Hu, Arielle Elkrief & Bertrand Routy
Department of Physiology, McGill University, Montreal, Quebec, Canada
Miranda W. Yu & Daniela F. Quail
Lady Davis Research Institute, McGill University, Montreal, Quebec, Canada
Ye Wang & Michael Pollak
McGill Centre for Microbiome Research, McGill University, Montreal, Quebec, Canada
Ken Dewar
Departments of Oncology and Medicine, McGill University, Montreal, Quebec, Canada
Michael Pollak
Hematology-Oncology Division, Department of Medicine, Centre Hospitalier de l’Université de Montréal, Montreal, Quebec, Canada
Arielle Elkrief & Bertrand Routy
Authors
- Lysanne DesharnaisView author publications
Search author on:PubMed Google Scholar
- Anikka SwabyView author publications
Search author on:PubMed Google Scholar
- Meriem MessaoudeneView author publications
Search author on:PubMed Google Scholar
- Samuel DoréView author publications
Search author on:PubMed Google Scholar
- Miranda W. YuView author publications
Search author on:PubMed Google Scholar
- Benoit FisetView author publications
Search author on:PubMed Google Scholar
- Valérie BretonView author publications
Search author on:PubMed Google Scholar
- Mayra PonceView author publications
Search author on:PubMed Google Scholar
- Yongjia HuView author publications
Search author on:PubMed Google Scholar
- Liam WilsonView author publications
Search author on:PubMed Google Scholar
- Mark SorinView author publications
Search author on:PubMed Google Scholar
- Ye WangView author publications
Search author on:PubMed Google Scholar
- Ken DewarView author publications
Search author on:PubMed Google Scholar
- Michael PollakView author publications
Search author on:PubMed Google Scholar
- Arielle ElkriefView author publications
Search author on:PubMed Google Scholar
- Bertrand RoutyView author publications
Search author on:PubMed Google Scholar
- Logan A. WalshView author publications
Search author on:PubMed Google Scholar
- Daniela F. QuailView author publications
Search author on:PubMed Google Scholar
Contributions
L.D., L.A.W. and D.F.Q. conceptualized and led the study. L.D., A.S., M.M., S.D. and M.W.Y. designed and performed experiments. V.B., M. Ponce, Y.H., L.W., M.S. and Y.W. provided technical support. Microbiome experiments and analysis were led by L.D., A.S., M.M. and B.F. with expert input from K.D., A.E. and B.R. Serum hormone data were contributed and interpreted by Y.W. and M. Pollak. L.D. and A.S. visualized the data. B.R., D.F.Q. and L.A.W. acquired funding, oversaw project administration and supervised the project. L.D., L.A.W. and D.F.Q. wrote the original and revised drafts of the manuscript with critical input from A.S., B.R. and M. Pollak. All co-authors reviewed, edited and approved the manuscript.
Ethics declarations
Competing interests
The authors declare no competing interests
Peer review
Peer review information
Nature thanks Emile Voest and the other, anonymous, reviewer(s) for their contribution to the peer review of this work
Additional information
Publisher’s note Springer Nature remains neutral with regard to jurisdictional claims in published maps and institutional affiliations
Extended data figures and tables
Extended Data Fig. 1 Diverse diet models drive metabolic and immunological signatures
a, Diet ingredient profiles. b, Body weight at diet initiation (week 0). n = 15 mice/group; 2 independent cohorts. c, Body weight after 15 weeks on diet (baseline). n = 14 mice, Jap; n = 15 mice, all other diets; 2 independent cohorts; mean ± s.e.m. d, Weight gain between 0-15 weeks on diet (fold change). e, f, Body composition analysis by EchoMRI. Proportion of lean and fat body mass (e), and fat mass as a percentage of body weight (f), in the 15-week diet model. n = 9 mice, Jap; n = 10 mice, all other diets. g, Glucose tolerance test in the 15-week diet model, presented as area under the curve (AUC). n = 10 mice/group, LF, HF, West; n = 5 mice/group, all other diets. h, Blood glucose at 0 (fasting), 30, 60, 90, and 120 min after intraperitoneal injection with 20% glucose. n = 10 mice/group, LF, HF, West; n = 5 mice/group, all other diets. i, Serum insulin levels in the 15-week diet model. n = 6 mice, Inu; n = 5 mice/group, all other diets. j, Correlation between baseline body weight and serum leptin levels in the 15-week diet model. n = 6 mice, Inu; n = 5 mice/group, all other diets. k, Normalized metabolic parameters used to calculate metabolic score for each diet. Diets are listed in order of increasing score, from left to right. Data presented as mean ± s.e.m. One-way ANOVA Dunnett’s multiple comparisons test relative to Low Fat control (c,d), one-way ANOVA Kruskal-Wallis test relative to Low Fat control (f,g,i), two-tailed Spearman correlation coefficient (j).
Source data
Extended Data Fig. 2 Tumour-infiltrating immune cell composition across dietary conditions
a, Flow cytometry analysis of intratumoural immune cell frequency at endpoint in the 15-week diet model. n = 4 mice, Jap, Pec, Veg, Amer; n = 5 mice, all other diets; graph shows mean value for each diet. Radial plots were generated in Flourish (Flourish Studio). b, Correlation between intratumoural immune cells and metabolic score or tumour volume in the 15-week diet model. Bubble colour, two-tailed Spearman correlation coefficient; bubble size, p-value
Source data
Extended Data Fig. 3 Gut microbiota composition is regulated by diet
a, Longitudinal 16S rRNA seq showing taxonomic composition of fecal bacteria at the family level throughout the 15-week diet model. Depicted timepoints include arrival to the McGill animal facility, after 1 week of acclimatization (standard chow), 3 days after introducing the new diets, and after 1, 3, or 7 weeks on the new diets. Corresponding endpoint data for the 15-week model can be found in Fig. 2b. Diets ordered by decreasing metabolic score, left-right. Bars represent individual mice. b, c, Alpha diversity (16S rRNA seq) measured by Chao1 richness (b) or Shannon diversity (c) indices throughout the acclimation period and the 15-week diet model corresponding to data in (a) and Fig. 2b; mean ± s.e.m. d, e, Chao1 richness (d) and Shannon diversity indices (e) in the 15-week diet model, corresponding to endpoint data in Fig. 2b. One-way ANOVA with Dunnett’s multiple comparisons test relative to Low Fat control (d); one-way ANOVA Kruskal-Wallis test relative to Low Fat control (e); box plots show media (centre line), interquartile range (box bounds), and minimum to maximum values (whiskers); all points are shown. f, Relative abundance of fecal microbiome phyla between six diets associated with a low metabolic score (MS) (n = 24 mice) and high metabolic score (n = 20 mice); two-tailed Mann-Whitney tests; mean ± s.e.m.
Extended Data Fig. 4 Anti-PD-1 sensitivity is more strongly regulated by diet than host metabolic features
a, Individual HKP1 tumour growth curves from IgG and anti-PD-1 treated mice enrolled on different diets, corresponding to data in Fig. 2f. b-g, Correlations between ICI sensitivity score and metabolic assays at baseline, including pre-tumour body weight (b), % fat mass (c), glucose tolerance (d), serum insulin (e), serum leptin (f) and metabolic score (g), corresponding to data in Figs. 1d-f and 2g. Two-tailed Spearman correlation coefficient; mean ± s.e.m. h, Proportion of diets associated with ICI response (R) and non-response (NR) in low and high metabolic score groupings.
Source data
Extended Data Fig. 5 Bacterial signatures of anti-PD-1 efficacy
a-b, Alpha diversity (16S rRNA seq), measured by Chao1 richness or Shannon diversity indices, in fecal samples from top NR diets (Psy, Med, Jap, Keto) vs R diets (Inu, Amer, Asp, HF) (a), or in IgG vs anti-PD-1 treated mice across all diet models (b). Two-tailed Mann-Whitney tests. Box plots show median (centre line), interquartile range (box bounds), and minimum to maximum values (whiskers). Each datapoint corresponds to 1 fecal pellet from 1 individual mouse; all replicate datapoints are shown. c, Taxonomic composition of fecal bacteria at the family-level (16S rRNA seq) from anti-PD-1 treated mice at endpoint. Diets are listed in order of increasing ICI sensitivity score, from left to right. d, Relative abundance of Lactobacillus in fecal bacteria from anti-PD-1 treated mice at endpoint; mean ± s.e.m. e, Relative abundance of Lactobacillus in fecal bacteria from low metabolic score responders (Inulin), high metabolic score non-responders (Mediterranean), and high metabolic score responders (American, Aspartame, High Fat). One-way ANOVA with Šídák’s multiple comparisons test; mean ± s.e.m. f, Correlations between ICI sensitivity score (corresponding to data in Fig. 2f,g) and relative abundance of top 4 genera associated with anti-PD-1 efficacy (Lactobacillus, Bifidobacterium, Faecalibaculum, and Akkermansia) in fecal bacteria from anti-PD-1 treated mice at endpoint. Two-tailed Spearman correlation coefficient; mean ± s.e.m. In all cases, fecal samples from a subset of mice from ICI trials in Fig. 2f,g were subject to 16S rRNA seq. This included n = 3 mice for Med IgG, Psy IgG, Veg IgG, Pec IgG, LF IgG and Keto anti-PD-1 groups, and n = 4 mice for all other groups; only anti-PD-1 groups were used for analyses in (a,c,d,e,f); 1 stool sample per mouse in all cases.
Extended Data Fig. 6 An obesogenic diet shapes gut microbiota composition and tumour progression independent of obesity status
a, Principal Coordinate Analysis (16S rRNA seq) using Bray-Curtis distance matrix at the ASV level for fecal samples at 7 timepoints for the 6 diets associated with high metabolic score. Statistical comparison between 3- and 15-week timepoints determined by PERMANOVA. P-values represent a one-sided test of the pseudo-F statistic. See Supplementary Table 12 for n-values corresponding to each diet and timepoint. b, c, Differences in body weight (b) and tumour volume (c) when age-matched mice are enrolled on diet for 3 weeks or 15 weeks. 3-week data include n = 4 mice, HF; n = 5 mice, all other diets; 15-week data from Fig. 1c (n = 5 mice/group) and Fig. 1m; multiple two-tailed Mann-Whitney tests; mean ± s.e.m. d, Correlation between HKP1 tumour volume and body weight in the 3-week diet model. n = 4 mice, HF; n = 5 mice, all other diets; two-tailed Spearman correlation coefficient; mean ± s.e.m. e, Schematic of the 3-week diet model with antibiotics, corresponding to (f). f, HKP1 tumour kinetics by calliper in the 3-week diet model with antibiotics or control water. n = 4 mice, HF water, West water, Keto antibiotics; n = 5 mice, all other groups; multiple two-tailed Mann-Whitney tests; mean ± s.e.m. g, Schematic of the 3-week diet model combining anti-PD-1 with Psy or HF diet, corresponding to Fig. 3m and (h). h, YUMM1.7 and YUMMER1.7 tumour kinetics by calliper in the 3-week diet model with anti-PD-1, comparing efficacy with the Psy diet (blue) or HF diet (orange). n = 4 mice, YUMMER1.7 Psy IgG; n = 5 mice, all other groups; multiple two-tailed Mann-Whitney tests; mean ± s.e.m.
Source data
Extended Data Fig. 7 Switching diet prior to anti-PD-1 treatment modulates ICI sensitivity and tumour immune infiltration
a, Body weight changes during Psyllium and High Fat diet switch trials. n = 20 mice, Psy-HF; n = 19 mice, HF-Psy. b-e, Flow cytometry on anti-PD-1 treated mice from the diet switch trials, quantifying intratumoural CD4+ T cells (b), intratumoural CD8+ T cells (c), IFNγ and TNFα production by CD4+ T cells stimulated ex vivo with PMA/ionomycin (d), and expression of CD44+, CD11a+ or PD-1+ on intratumoural CD4+ T cells (e). n = 4 mice, Psy-HF; n = 5 mice, HF-Psy; two-tailed unpaired t-tests; mean ± s.e.m.
Source data
Extended Data Fig. 8 Diet shapes the gut microbiota after FMT
a, Schematic of the 3-week diet model with antibiotics, combining anti-PD-1 with LF or HF diet, corresponding to (b). b, HKP1 tumour kinetics via calliper in antibiotics-treated mice fed LF or HF diet, receiving IgG or anti-PD-1. n = 4 mice, HF anti-PD-1; n = 5 mice, all other groups. c, Geometric mean fluorescence intensity for Granzyme B, IFNγ or TNFα production by CD8+ T cells following ex vivo stimulation with PMA/ionomycin, after a 72-hour exposure to PBS, or fecal homogenate from High Fat diet-fed mice (HF) or antibiotic-treated High Fat diet-fed mice (HF + ABX). n = 4 wells/group, using pooled fecal homogenate from 5 mice/group and CD8+ T cells from 3 mouse spleens; one-way ANOVA Kruskal-Wallis test. d, Schematic for Psy→Psy control experiment for Fig. 4l-o, corresponding to (e,f,j). e, f, HKP1 tumour kinetics by calliper (e) and endpoint tumour volume (f) in the Psy→Psy control experiment. n = 5 mice/group; two-tailed unpaired t-test. g, Schematic for PBS → HF control experiment for Fig. 4l-o, corresponding to (h-j). h, i Tumour growth kinetics via calliper (h) and endpoint tumour volume (i) in the PBS → HF control experiment. n = 5 mice/group; two-tailed unpaired t-test. j, Body weight changes throughout FMT trials. n = 10 mice/group. k, 16S rRNA seq showing taxonomic composition of fecal bacteria at the family level, comparing Psyllium donors with FMT recipients treated with HF diet and anti-PD-1. Three timepoints were analyzed for FMT recipients, including pre-antibiotics (baseline, prior to FMT), anti-PD-1 initiation (1st treatment dose), and endpoint. n = 5 mice/group. l, Log2 fold change for dominant bacterial families from data in (k). Graph includes bacteria that are >5% average abundance in either donor or recipient mice for each comparison. Positive values are enriched in FMT recipients and negative values are enriched in FMT donors. Presented data are statistically significant by two-tailed Mann-Whitney test. m, Relative abundance of Muribaculaceae in fecal bacteria (16S rRNA seq) from FMT donors and recipients. n = 5 mice per group; one-way ANOVA with Dunnett’s multiple comparisons test relative to donors. Data presented as mean ± s.e.m.
Source data
Extended Data Fig. 9 L. johnsonii enhances ICI efficacy in combination with High Fat diet
a, Schematic for L. johnsonii monocolonization (GF) model with MCA205 cells, corresponding to (b,c). HF diet was administered continuously throughout the trial. b, c MCA205 tumour kinetics by calliper (b) and endpoint tumour volume (c) in the L. johnsonii monocolonization model with HF diet, comparing anti-PD-1 and IgG. n = 5 mice/group. d, Schematic for M. gordoncarteri monocolonization (GF) and single-strain supplementation (SPF) models with HKP1 cells, corresponding to (e-h). HF diet was administered continuously throughout the trials. e, f, HKP1 tumour kinetics by calliper (e) and endpoint tumour volume (f) in the M. gordoncarteri monocolonization model with HF diet, comparing anti-PD-1 and IgG. n = 4 mice, IgG; n = 5 mice, anti-PD-1. g, h, HKP1 tumour kinetics by calliper (g) and endpoint tumour volume (h) in the M. gordoncarteri single-strain supplementation model with HF diet, comparing anti-PD-1 and IgG. n = 5 mice/group. i, Schematic for L. johnsonii monocolonization (GF) model with HKP1 cells, corresponding to (j,k). Psy diet was administered continuously throughout the trial. j, k, HKP1 tumour kinetics by calliper (j) and endpoint tumour volumes (k) in the L. johnsonii monocolonization model with Psy diet, comparing anti-PD-1 and IgG. n = 4 mice, IgG; n = 5 mice, anti-PD-1. l, qPCR to detect L. johnsonii in endpoint fecal samples from anti-PD-1-treated mice in monocolonization models as indicated (x-axis). n = 4 mice, HF + Lj; n = 5 mice, Psy + Lj, HF + PBS; 1 stool sample/mouse. Data presented as mean ± s.e.m. Two-tailed Mann-Whitney tests (b,e,g,j,k), one-way ANOVA with Šídák’s multiple comparisons test (c), two-tailed unpaired t-tests (f,h,l).
Source data
Extended Data Fig. 10 Aromatic amino acid metabolism is associated with enhanced anti-PD-1 efficacy and T cell activity
a, b, Volcano plot of differentially abundant serum metabolites between top 4 ICI R diets (HF, Asp, Amer, Inu) versus NR diets (Psy, Med, Jap, Keto) (a), and obesogenic R diets (HF, Amer) versus obesogenic NR diets (Med, Keto) (b). Fold change threshold = 1.2; p-value threshold <0.05. n = 4 mice, Asp; n = 5 mice, all other diets. c, Flow cytometry on CD8+ T cells following ex vivo exposure to indolelactic acid (ILA), indole-3-acetic acid (IAA), indolepyruvic acid (IPyA), or indole-3-propionic acid (IPA). Graphs show the proportion of PD-1+, Granzyme B+, Ki67+ or IFNγ+ cells in response to treatment, normalized to vehicle control (DMSO). n = 3 wells/group, using splenocytes from 3 mouse spleens. d, Normalized concentration (Log2Ratio) of ILA, IAA, IPyA, and IPA in mouse serum, corresponding to dataset in (b). Two-tailed Mann-Whitney tests. e, Geometric mean fluorescence intensity for Granzyme B, IFNγ or TNFα production by CD8+ T cells following ex vivo stimulation with PMA/ionomycin, after a 72-hour exposure to PBS, 1 mM desaminotyrosine (DAT), fecal homogenate from Psyllium mice (Psy) or DAT + Psy. n = 4 wells/group, using pooled fecal homogenate from 5 mice/group and CD8+ T cells from 3 mouse spleens; one-way ANOVA Kruskal-Wallis test. f, Normalized concentration (Log2Ratio) of 3-(4-Hydroxyphenyl)lactic acid, 4-Hydroxyphenylacetic acid, and 3-(4-Hydroxyphenyl)pyruvic acid in mouse serum, corresponding to dataset in (b). Two-tailed Mann-Whitney tests. g, Schematic of human-to-mouse FMT from low BMI (<25) or high BMI (≥25) donors, corresponding to (h,i). h,i, Individual tumour kinetics by calliper (h), and tumour volume at endpoint (i) from mice in the human-to-mouse FMT trial with low/high BMI donors. BMI < 25 (n = 15 mice from 3 patient donors), BMI ≥ 25 (n = 30 mice from 6 patient donors); in all cases, donor material from 1 patient was transferred to 5 mice each (shape-matched datapoints); one-way ANOVA Kruskal-Wallis test; mean ± s.e.m. Note that in (i), the open-circle datapoints in the BMI < 25 group represent a patient donor with BMI = 24.95.
Source data
Extended Data Fig. 11 Shifts in the gut microbiome during tumour progression across diets
Principal Coordinate Analysis (16S rRNA seq) using Bray-Curtis distance matrix at the ASV level for fecal samples collected from mice in IgG control groups before tumour injection, 1-week post-tumour injection and 3-weeks post-tumour injection (endpoint). The table below each plot summarizes the result of pairwise PERMANOVA analysis. The multi-testing adjustment is based on Benjamini-Hochberg procedure (FDR). Diets are presented in order of increasing metabolic score
Extended Data Fig. 12
Flow cytometry gating strategy for identification of major immune populations in tumour and blood
Supplementary information
Supplementary Figures 1 and 2 (download PDF )
Correlation analyses corresponding to data in Fig. 1h
Reporting Summary (download PDF )
Supplementary Tables (download PDF )
Supplementary Tables 1–3 and 8–11: diet ingredients and macronutrient profiles (Supplementary Tables 1 and 2), clinical information corresponding to Fig. 5j,k (Supplementary Table 3), Fig. 5w (Supplementary Table 8), Extended Data Fig. 10h,i (Supplementary Table 9), and tables referenced in methodology (Supplementary Tables 10 and 11)
Supplementary Table 4 (download XLSX )
Mouse serum metabolomics (high fat, American, aspartame, inulin, ketogenic, Mediterranean, Japanese and psyllium) corresponding to Fig. 5m,n,p and Extended Data Fig. 10a,b
Supplementary Table 5 (download XLSX )
Mouse serum metabolomics (germ-free mice monocolonized with L. johnsonii) corresponding to Fig. 5o
Supplementary Table 6 (download XLSX )
Bacteria culture metabolomics corresponding to Fig. 5q
Supplementary Table 7 (download XLSX )
Patient plasma metabolomics corresponding to Fig. 5w–y
Supplementary Table 12 (download XLSX )
n values for model characterization analyses
Source data
Source Data Fig. 1 (download XLSX )
Source Data Fig. 2 (download XLSX )
Source Data Fig. 3 (download XLSX )
Source Data Fig. 4 (download XLSX )
Source Data Fig. 5 (download XLSX )
Source Data Extended Data Fig. 1 (download XLSX )
Source Data Extended Data Fig. 2 (download XLSX )
Source Data Extended Data Fig. 4 (download XLSX )
Source Data Extended Data Fig. 6 (download XLSX )
Source Data Extended Data Fig. 7 (download XLSX )
Source Data Extended Data Fig. 8 (download XLSX )
Source Data Extended Data Fig. 9 (download XLSX )
Source Data Extended Data Fig. 10 (download XLSX )
Rights and permissions
Open Access This article is licensed under a Creative Commons Attribution-NonCommercial-NoDerivatives 4.0 International License, which permits any non-commercial use, sharing, distribution and reproduction in any medium or format, as long as you give appropriate credit to the original author(s) and the source, provide a link to the Creative Commons licence, and indicate if you modified the licensed material. You do not have permission under this licence to share adapted material derived from this article or parts of it. The images or other third party material in this article are included in the article’s Creative Commons licence, unless indicated otherwise in a credit line to the material. If material is not included in the article’s Creative Commons licence and your intended use is not permitted by statutory regulation or exceeds the permitted use, you will need to obtain permission directly from the copyright holder. To view a copy of this licence, visit http://creativecommons.org/licenses/by-nc-nd/4.0/.
About this article
Cite this article
Desharnais, L., Swaby, A., Messaoudene, M. et al. Diet–microbiome synergy underlies obesity-associated immunotherapy efficacy.
Nature (2026). https://doi.org/10.1038/s41586-026-10750-x
Received:21 June 2024
Accepted:02 June 2026
Published:08 July 2026
Version of record:08 July 2026
DOI
:https://doi.org/10.1038/s41586-026-10750-x
