


July marks the warmest month on record for the contiguous U.S
Courtesy of Canva.com
Key Takeaways:
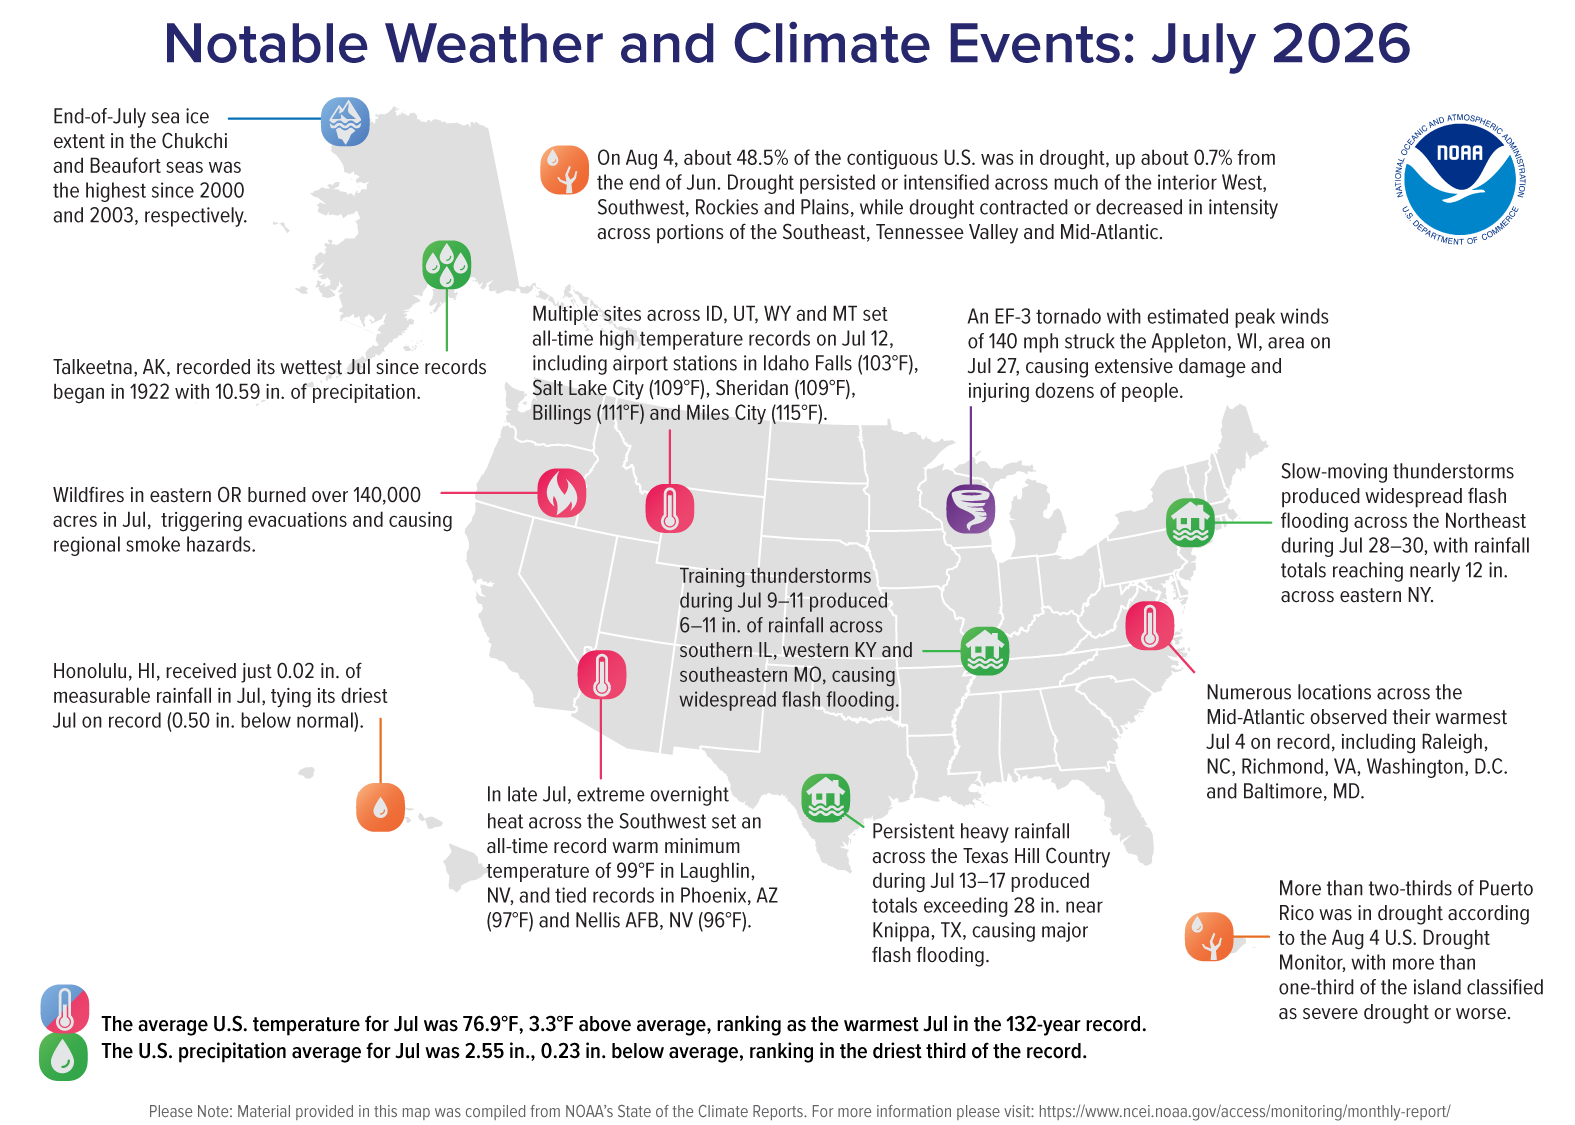
Warmest on record: July 2026 averaged 76.9°F, the warmest month on record (1895–present) for the contiguous United States (CONUS)
Widespread warmth: Above-average temperatures covered the entire CONUS, with all states ranking in the warmest third of their July temperature records and none ranking near or below average
Dry with regional flooding events: Despite below-average July precipitation for the CONUS as a whole, several regions experienced heavy rainfall, including major flash flooding events in the Texas Hill Country and eastern New York.
Alaska cool: Alaska had the coldest July average temperature since 2008
Other Highlights:
Temperature
The average temperature for the CONUS in July was 76.9°F, 3.3°F above the 20th-century average. This was the warmest July—and warmest month—in the 132-year record, 0.1–0.2°F warmer than July 1936 and July 2012
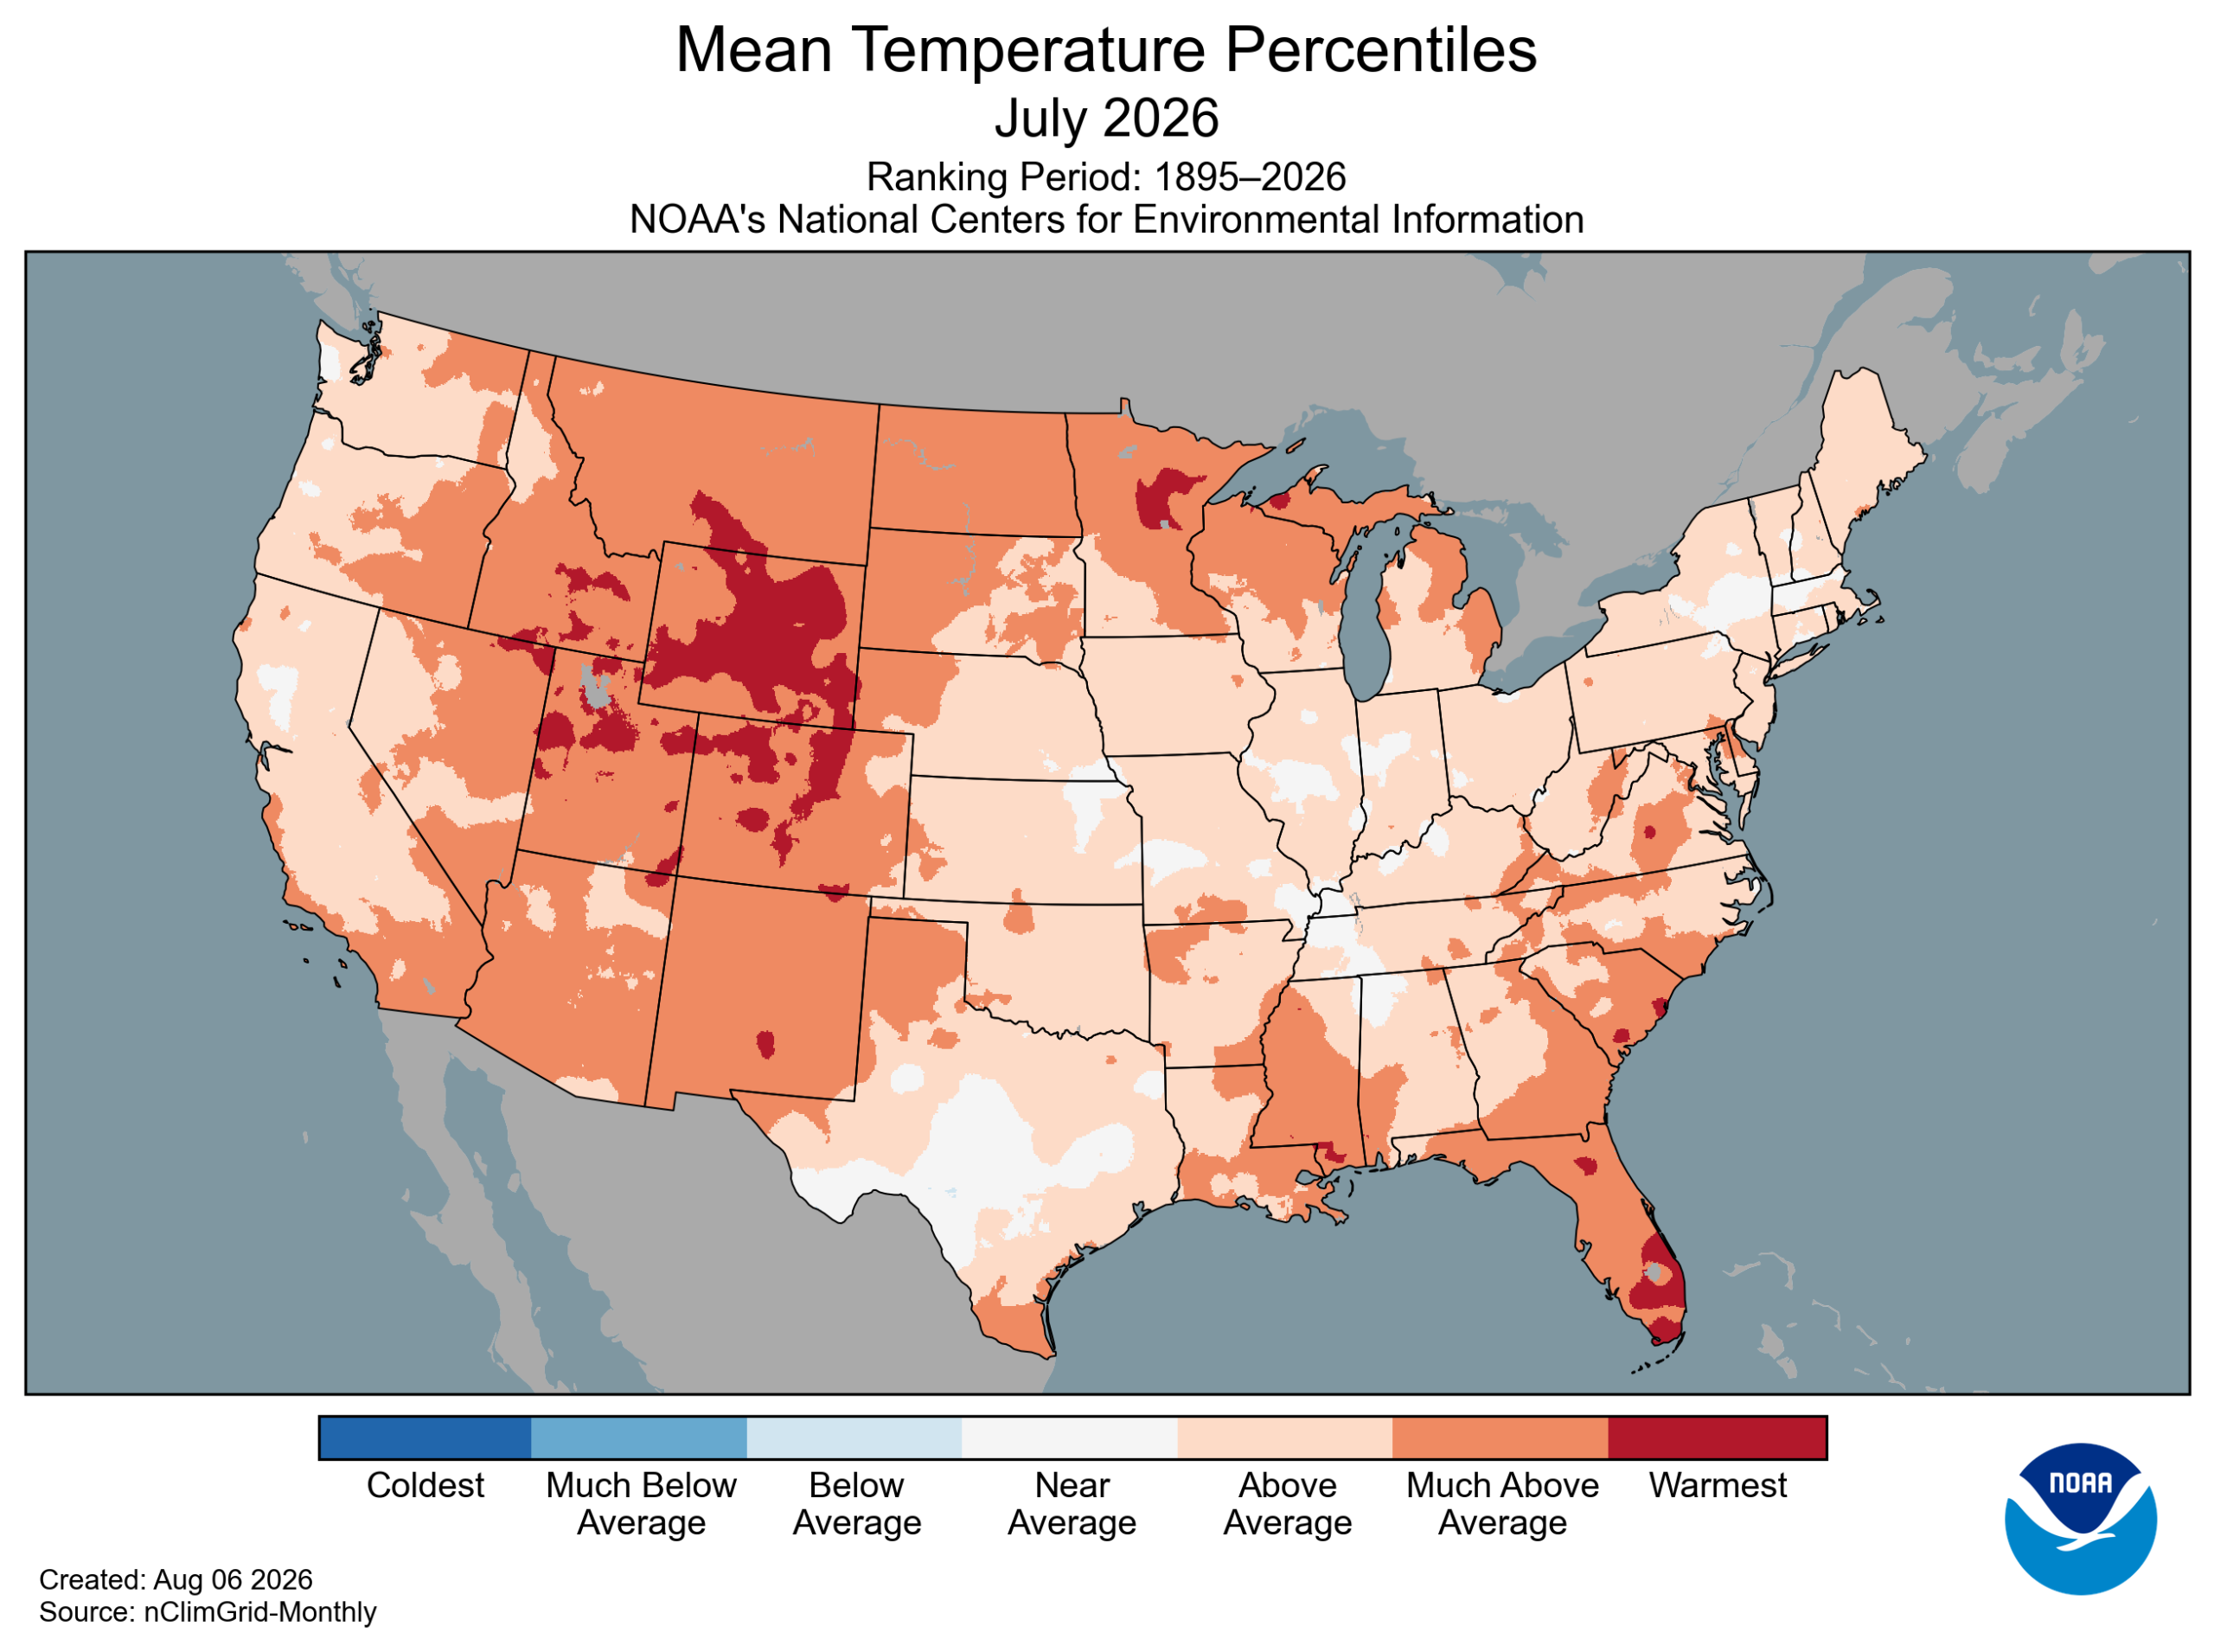
Daytime maximum temperatures averaged 89.5°F, 2.9°F above average, ranking as the sixth-warmest month on record for average high temperatures, while overnight minimum temperatures averaged 64.2°F, 3.7°F above average, ranking as the warmest month on record for average low temperatures, surpassing July 2022 by 0.7°F
Above-average temperatures extended across the entire CONUS in July, with much-above-average temperatures observed throughout much of the interior West, Southwest, Rockies, northern Plains and Upper Midwest, as well as parts of the Gulf Coast and Southeast. All CONUS states were at least 1°F above their 20th-century average, with 13 states ranking among their five warmest Julys. Wyoming recorded its warmest July and warmest month on record, with temperatures 5.1°F above average and 0.9°F warmer than its previous July record set in 2007.
Alaska’s average temperature was 51.8°F, 0.9°F below the 1925–2000 average, ranking in the coolest third of the 102-year record. Below-average temperatures were observed across portions of the interior, as well as parts of the Alaska Peninsula and Panhandle.Hawai’i’s average temperature was 69.4°F, 0.6°F above the 1991–2020 average, ranking in the middle third of the 36-year record. While overnight minimum temperatures were above- to much-above average across the island chain, daytime temperatures were near or below average for the month.
Precipitation
Total precipitation averaged across the CONUS in July was 2.55 inches, 0.23 inch below the 20th-century average, ranking in the driest third of the 132-year record
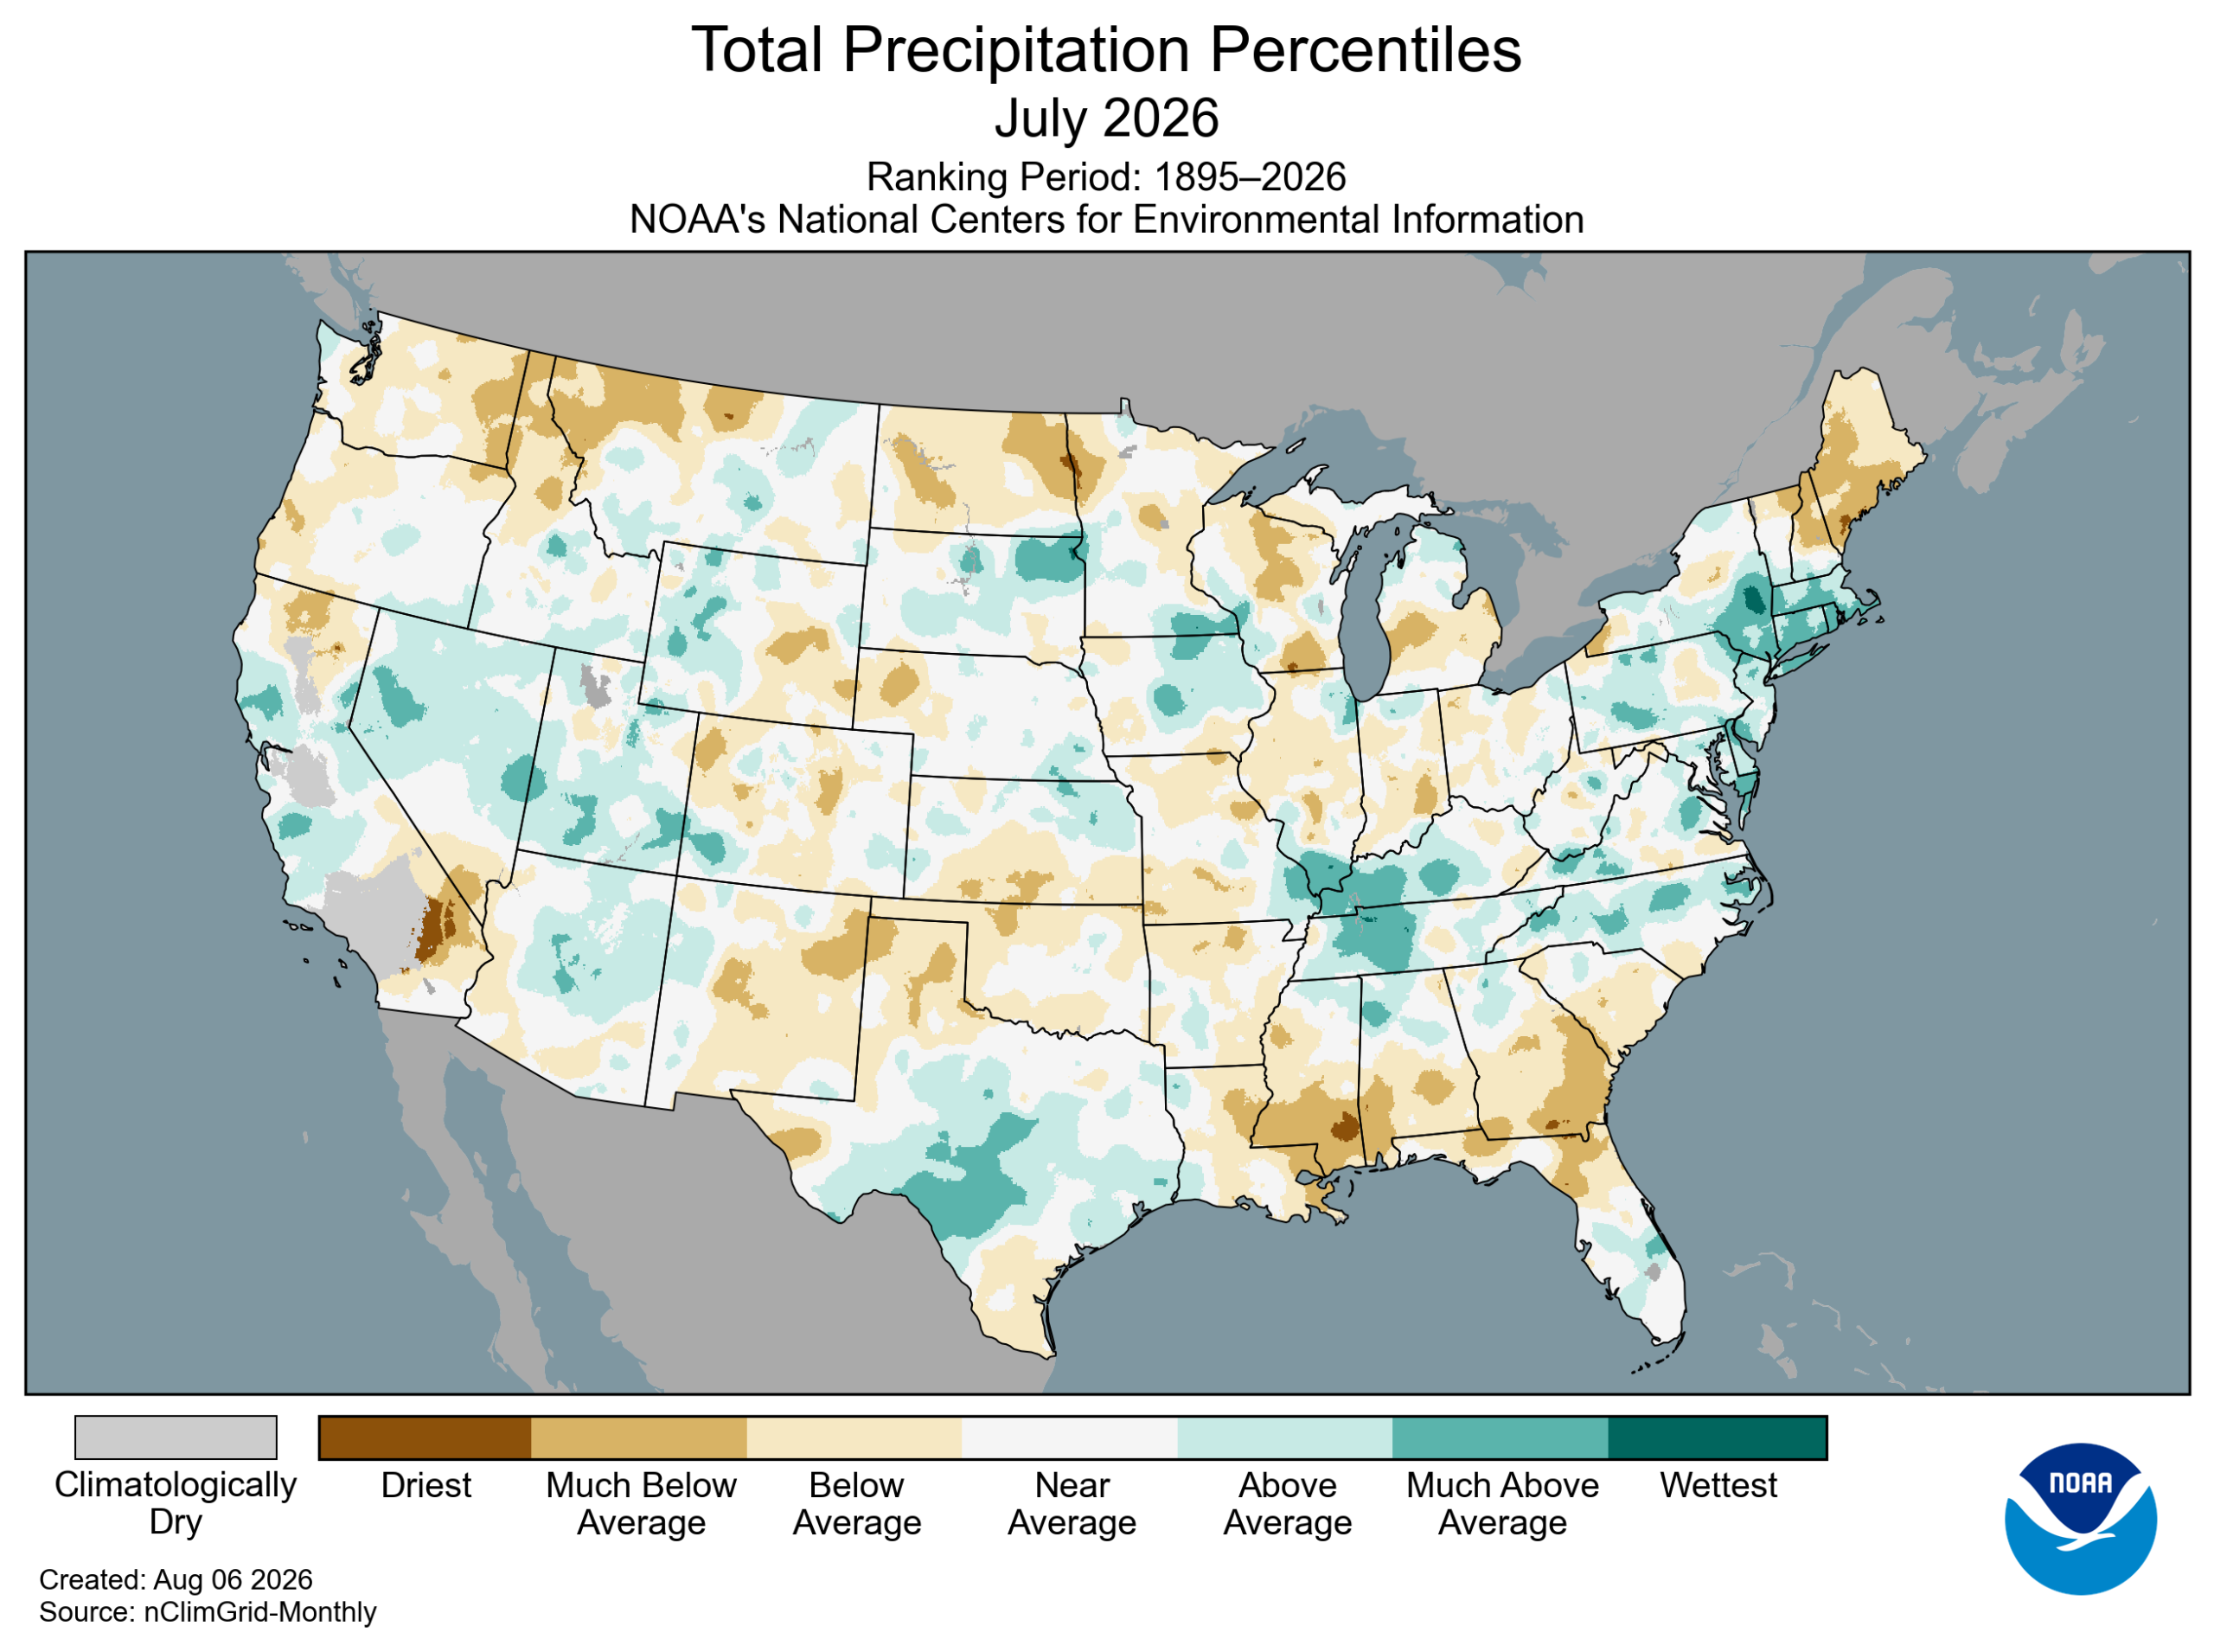
Precipitation across the CONUS during July reflected a mix of wet and dry conditions. Below-average precipitation occurred across portions of the northern tier, including parts of the northern Rockies, northern Plains, Upper Midwest and Northeast, as well as parts of the southern Plains, Mississippi Valley, Central Gulf and Southeast. In contrast, pockets of above-average precipitation were observed across parts of the West and Southwest, central Plains and Upper Midwest, as well as portions of Texas, the Tennessee and lower Ohio Valleys, Mid-Atlantic and lower Northeast.
Alaska’s average precipitation was 4.30 inches in July, 1.02 inches above the 1925–2000 average, ranking in the wettest third of the 102-year record. Southern and southwestern portions of the state, including the Alaska Peninsula, received above-average to much-above-average precipitation, with Anchorage tying its highest July precipitation total on record. In contrast, portions of the Alaska Panhandle received below-average precipitation
Hawaiʻi averaged 5.20 inches of precipitation in July, 0.56 inch above the 1991–2020 average, ranking in the wettest third of the 36-year record, despite localized regions that saw below-average totals. The year-to-date statewide precipitation total remained the wettest on record, with a January–July total of nearly five feet (59.82 inches), 25.43 inches above average (173.9% of normal)
Drought
According to the August 4 U.S. Drought Monitor, about 48.5% of the CONUS was in drought, an increase of about 0.7 percentage points since the end of June. Drought persisted over much of the interior West, Southwest and Rockies, and expanded or intensified across parts of the Northwest, southern and northern Plains, Upper Midwest and far Northeast. In contrast, drought contracted or decreased in intensity across portions of the Lower Mississippi Valley, Tennessee Valley and much of the Southeast and Mid-Atlantic region. In Puerto Rico, more than two-thirds of the island was in drought, with more than one-third classified as severe drought or worse.
Monthly Outlook
Above-average August temperatures are favored across the central and southern tiers of the CONUS, with portions of coastal California and the southern Plains having a greater than 50 percent likelihood of above-average temperatures. Precipitation has equal chances of being above or below average across much of the CONUS, except in parts of the interior West and Southwest where above-average rainfall is favored and in portions of the southern Plains and Lower Mississippi Valley where below-average precipitation is favored. Visit the Climate Prediction Center’s Official 30-Day Forecasts for more details.
Drought is expected to persist and expand across parts of the Northwest and east of the Rockies, including portions of the Plains and Upper Midwest, as well as in Puerto Rico and the U.S. Virgin Islands. Drought conditions are expected to improve across parts of the interior West and Southwest, and along much of the eastern seaboard. Visit the U.S. Monthly Drought Outlook website for more details
Significant wildland fire potential for August is above normal across the Northwest, Great Basin and central Rockies, parts of the northern and southern Plains, the Lower Mississippi Valley, southern Florida and Puerto Rico. For additional information on wildland fire potential, visit the National Interagency Fire Center’s One-Month Wildland Fire Outlook
For more detailed climate information, check out our comprehensive July 2026 U.S. Climate Report scheduled for release on August 13, 2026. For additional information on the statistics provided here, visit the Climate at a Glance and National Maps webpages
